Resources /
Blogs
Why Even Good HCP Plans Fail Without Pollen & ILI layer
August 28, 2026
Anshu Singh

Commercial teams in allergy and respiratory have spent years refining HCP engagement. Call plans are optimized. Prescriber deciles are sharper. Targeting models combine claims data, digital signals, and behavioral segmentation. On paper, everything is dialed in.
Yet territory performance still swings, often without a clear reason.
One territory consistently outperforms. Another, with nearly identical HCP mix, access, and competitive pressure, underdelivers. Field teams point to messaging, access barriers, or competition. Those factors matter, but they rarely explain the full gap.
What’s missing is the upstream driver. The environment.
Pollen spikes. Air quality shifts. Weather volatility. These factors directly influence symptom burden, patient visits, and prescribing behavior. When environmental triggers change, demand changes. But most commercial models don’t account for this layer.
So performance appears unpredictable. In reality, it’s reacting to signals no one is measuring.
Add environmental intelligence, and those unexplained swings start to look less like noise and more like pattern.
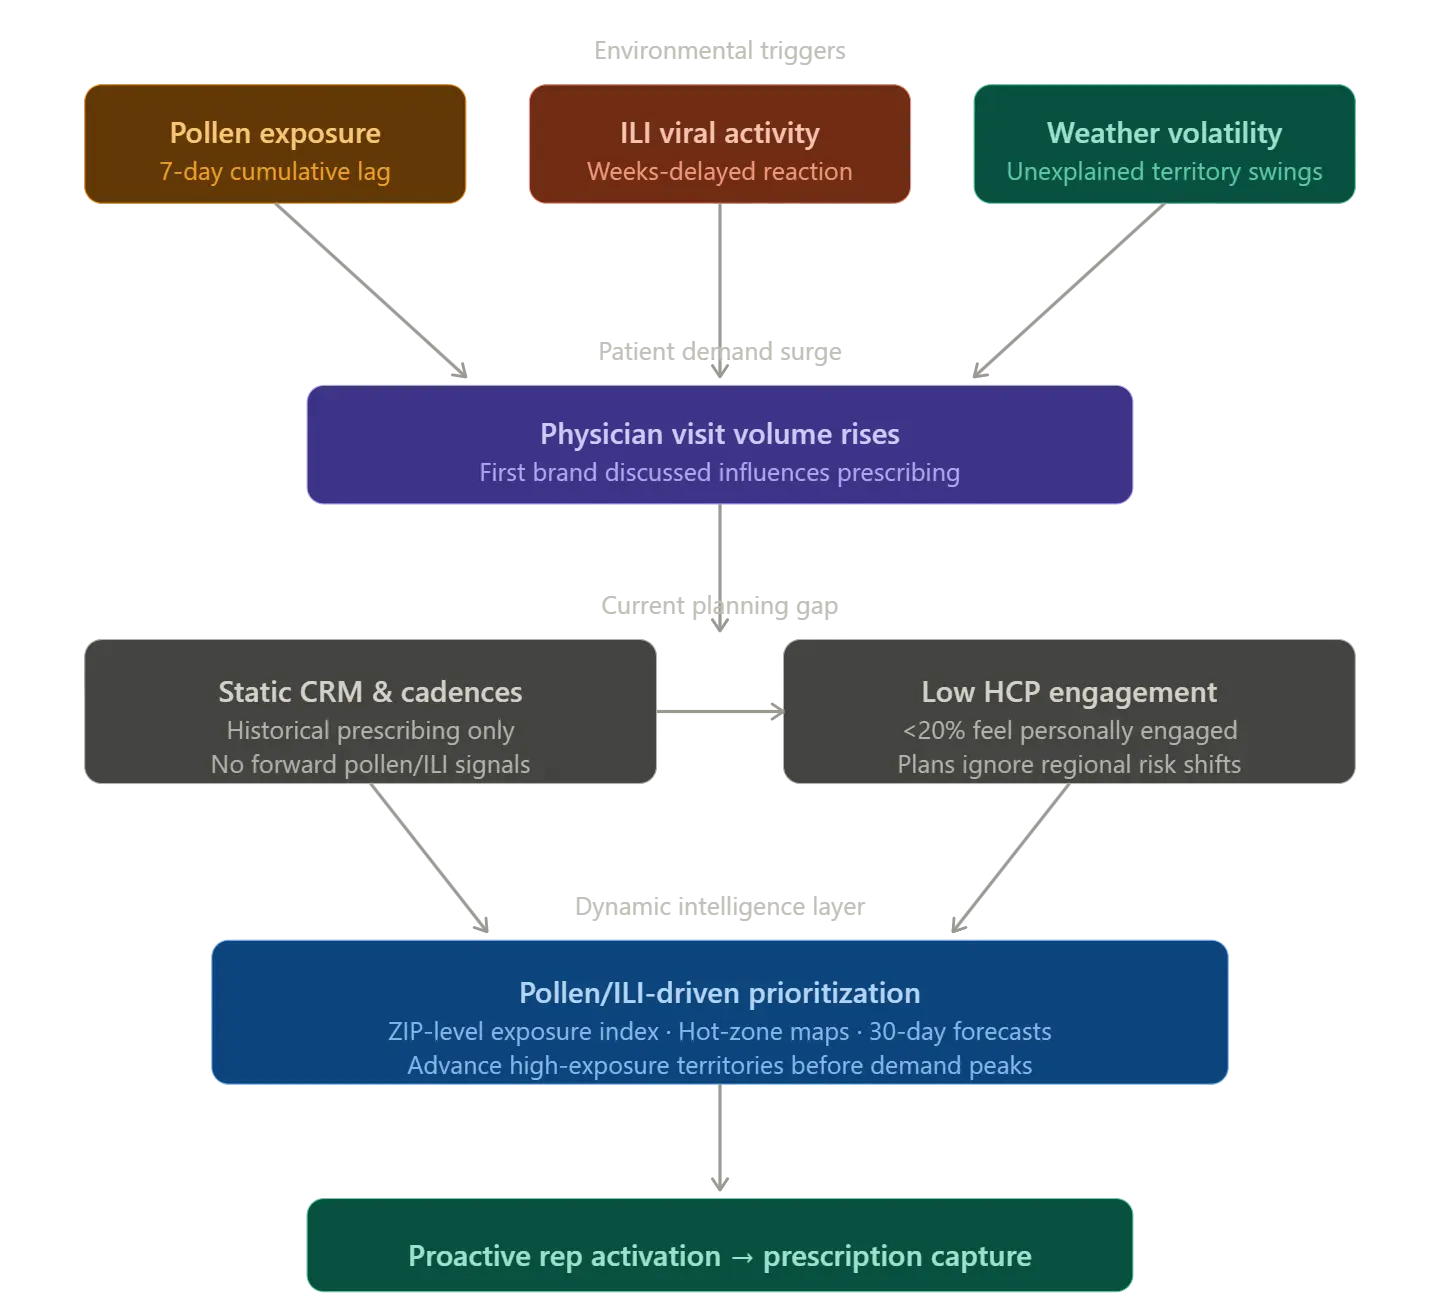
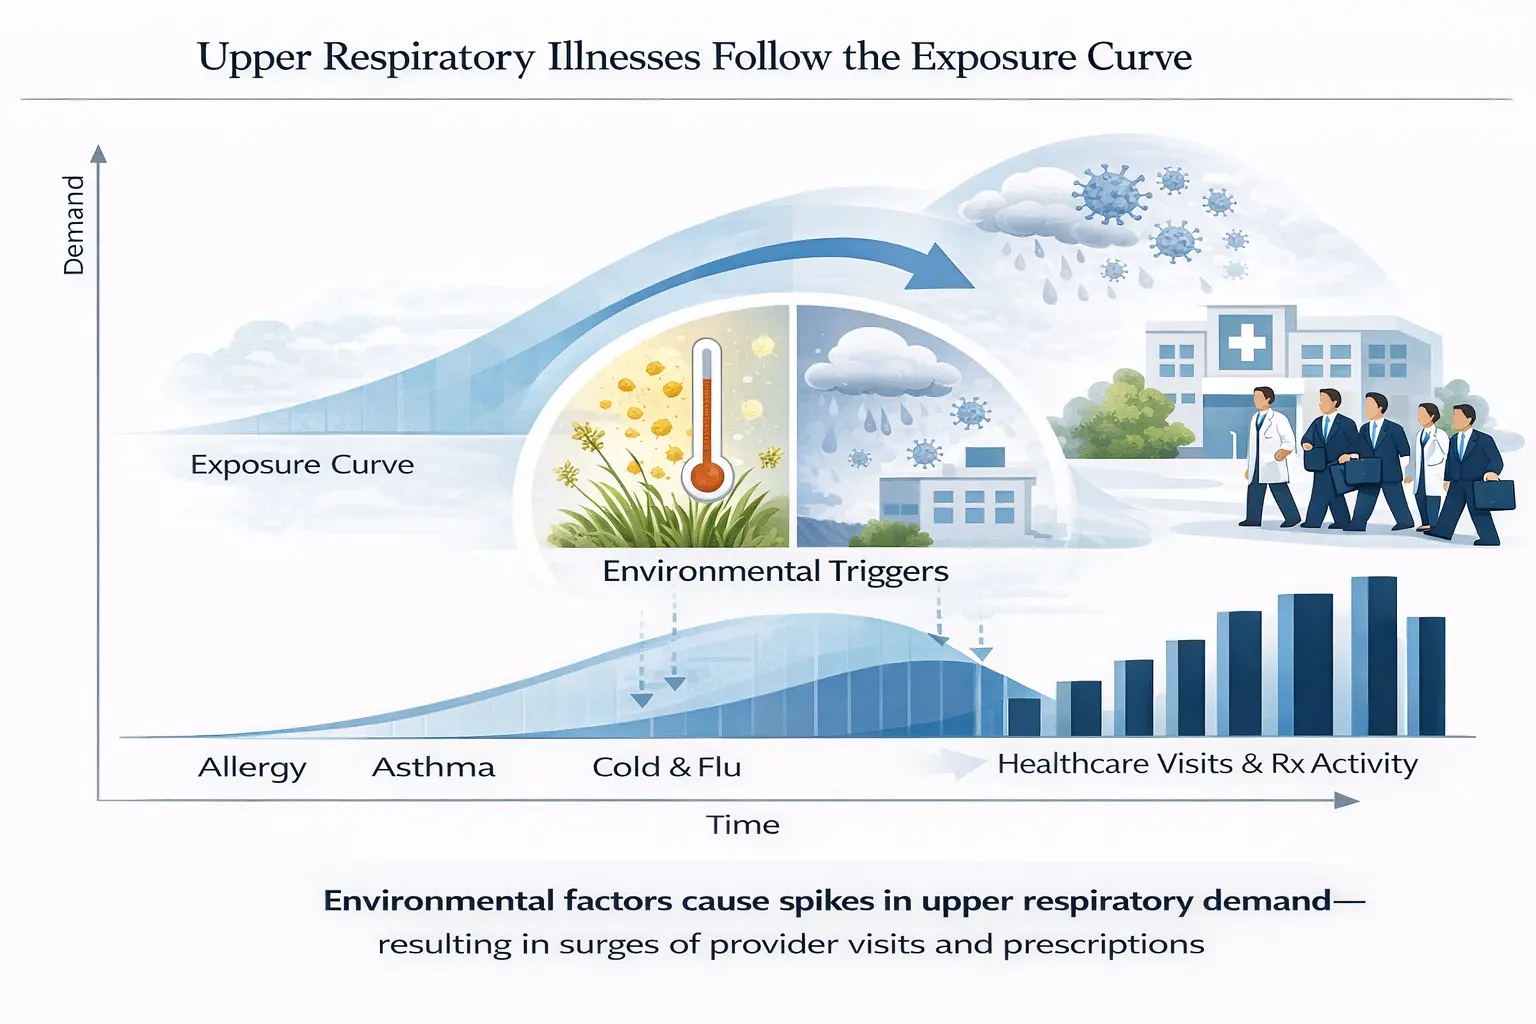
The connection between pollen exposure and allergy-related healthcare visits isn’t anecdotal. A multi-city analysis linking pollen data with health claims found that physician visits for allergic rhinitis rose as pollen concentrations increased, and prescription fills tracked tree and weed pollen exposure. Crucially, seven-day cumulative exposure predicted demand better than same-day pollen levels which means the signal arrives before the prescriptions do.(https://www.ncbi.nlm.nih.gov/pmc/articles/PMC8296728/)
That’s the commercial implication. Demand isn’t random or evenly distributed. It follows an exposure curve, and that curve is forecastable.
Most engagement plans, though, are built on prior prescribing behavior, static call frequency, and quarterly cadences. None of those variables know that a region just crossed from moderate to high pollen risk. A territory that historically ranked mid-tier can see symptomatic patient volume spike within a week. If the call plan doesn’t move, the visit arrives after the patient wave already has or during the wave in the zip-code.
ILI follows a parallel logic. Respiratory infections rise. Outpatient visits increase. Physicians see more patients presenting with respiratory complaints and adjust therapy accordingly. CDC surveillance data shows this pattern reliably across seasons — visit volume and prescription activity both track viral circulation (https://www.cdc.gov/respiratory-viruses/data/activity-levels.html)
Research examining influenza-related healthcare utilization confirms that increased viral activity is associated with measurable increases in physician visits and prescribing across multiple seasons (https://journals.plos.org/plosone/article?id=10.1371%2Fjournal.pone.0069408, https://pmc.ncbi.nlm.nih.gov/articles/PMC3994788/).
The sequence is the same as in allergy: the environmental trigger comes first, and then the scope of commercial opportunity arises. Engagement plans that treat the environment as background noise rather than a timing signal are working with incomplete information.
The standard engagement plans, which rely on historical curves.
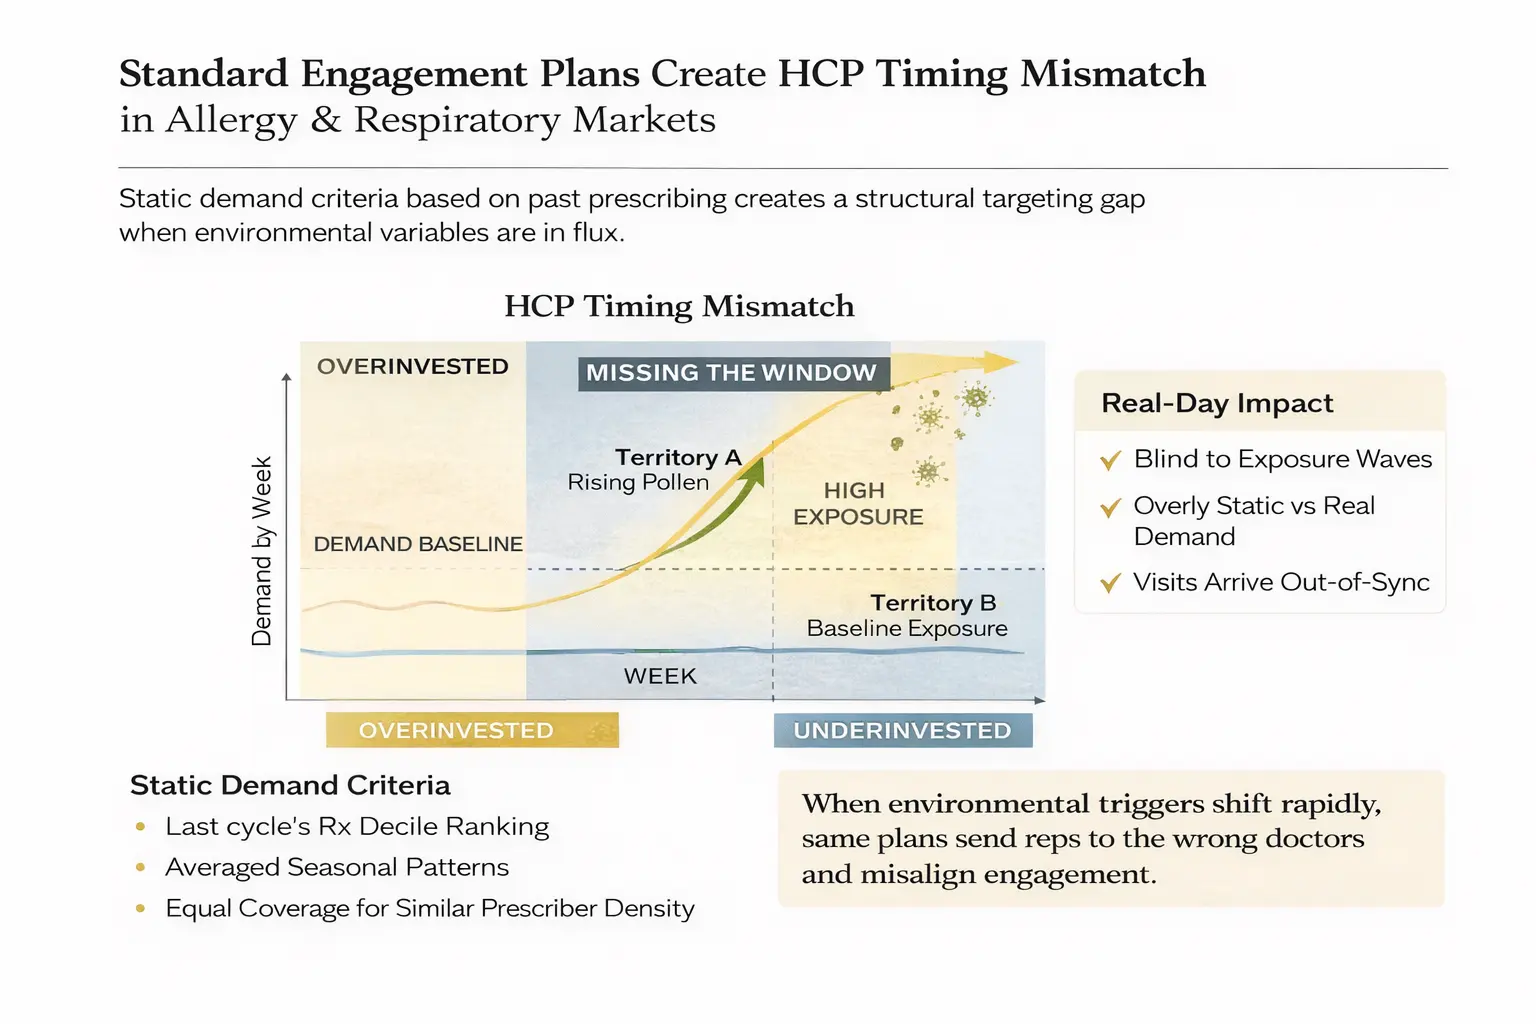
Standard engagement models assume that demand is roughly stable across geographies, across weeks in a quarter, and across territories with similar prescriber density compared to last cycle's average and seasonal patterns. In most therapeutic categories, that’s a reasonable approximation. In allergy and respiratory, it isn’t. (https://pubmed.ncbi.nlm.nih.gov/8711764/)
Two territories with identical prescriber deciles can behave completely differently based on what’s happening environmentally. One is experiencing rising pollen exposure and increasing patient volume. The other is at baseline. Without environmental context, they receive identical field coverage.
The result is predictable: excessive effort in the area where demand isn't growing and underinvestment in the area where it is. It's not an execution issue. It is a visibility issue that creating an “HCP timing mismatch” that cannot be resolved by fine-tuning decile cutoffs or adding an additional segmentation layer.
Let’s understand why HCP timing mismatches are linked with climate.
In allergy and cold & flu, timing matters more than most commercial teams account for. Physicians adjust therapy when symptomatic patients are in front of them. The first brand discussed in that window has an outsized influence on what gets prescribed.
If a rep visits during the high patient volume, the message fades. If the visit based on same If they arrive two weeks after, someone else already had that conversation.
The pollen research cited makes this concrete: healthcare visits increase following cumulative exposure, not immediately. (https://www.ncbi.nlm.nih.gov/pmc/articles/PMC8296728/ ).
There’s a lag between exposure and prescribing behavior, and that lag is a window for field activation. ILI surveillance data shows the same structure — outpatient volumes rise in correlation with seasonal viral activity, giving commercial teams a forecastable demand signal if they’re watching it. (https://academic.oup.com/cid/article/79/3/778/7639444 )
HCP engagement and omnichannel plans that ignore these signals end up distributing effort evenly across time, rather than concentrating it when it counts.
In allergy and cold & flu, timing matters more than most commercial teams account for. Physicians adjust therapy when symptomatic patients are in front of them. The first brand discussed in that window has an outsized influence on what gets prescribed. (https://www.getambee.com/blogs/why-allergy-hcp-engagement-fail)
The pollen research cited makes this concrete: healthcare visits increase following cumulative exposure, not immediately — creating a lag between exposure and prescribing behavior that is a window for field activation. (https://pubmed.ncbi.nlm.nih.gov/17910325/ , https://pmc.ncbi.nlm.nih.gov/articles/PMC3658798/ ) ILI surveillance data shows the same structure — outpatient volumes rise in correlation with seasonal viral activity, giving commercial teams a forecastable demand signal if they're watching it. (https://pmc.ncbi.nlm.nih.gov/articles/PMC3994788/ https://www.cdc.gov/respiratory-viruses/data/activity-levels.html)
HCP engagement and omnichannel plans that ignore these signals end up distributing effort evenly across time, rather than concentrating it when it counts.
Most commercial organizations have CRM systems, call planning tools, segmentation models, and digital engagement programs. These tools do one thing well: they tell you who to visit. They don't tell you when that clinician is about to see a surge of symptomatic patients. (https://www.mckinsey.com/jp/en/our-insights/demystifying-the-omnichannel-commercial-model-for-pharma-companies-in-asia)
Prescriber deciles identify historically high prescribers. A decile score doesn't tell you which of those physicians will have an unusually busy allergy week starting Thursday. Claims data captures past prescribing, but past prescribing reflects exposures that already happened. Even analytics platforms that surface historical trends faster than before aren't forecasting the demand drivers, they're just showing you what already occurred.
The gap is a forward-looking environmental layer: pollen exposure forecasts by geography, ILI activity trends. Without it, every other piece of infrastructure stays reactive.
A territory manager planning coverage for an allergy biologic knows which clinicians to prioritize. Call frequency is spread across the quarter. On paper, it looks like solid execution.
Then pollen moves. Tree pollen rises sharply in two postal codes in week three. Grass pollen begins in a neighboring region by week four. Symptoms peak in week five. The call plan doesn’t know any of this, so reps are visiting lower-priority areas during the weeks when high-demand geographies are most active.
The missed prescriptions aren’t because the right prescribers weren’t targeted. They’re because the timing was wrong for that zip-code and the critical check-in briefs followed standard template.
Cold & flu territory planning has the same problem. ILI activity tends to increase first in specific geographies before spreading. Uniform call plans can’t capture localized surges because they’re not watching for them.
And patterns now have solidified. According to Indegene, fewer than 20% of
HCPs feel personally engaged today. (omnichannel-strategies-pharma-needs.pdf)
Static planning and delayed data cause missed seasonal opportunities, weakening HCP engagement and costing valuable prescription share. Integrating pollen and ILI data into engagement planning changes three things.
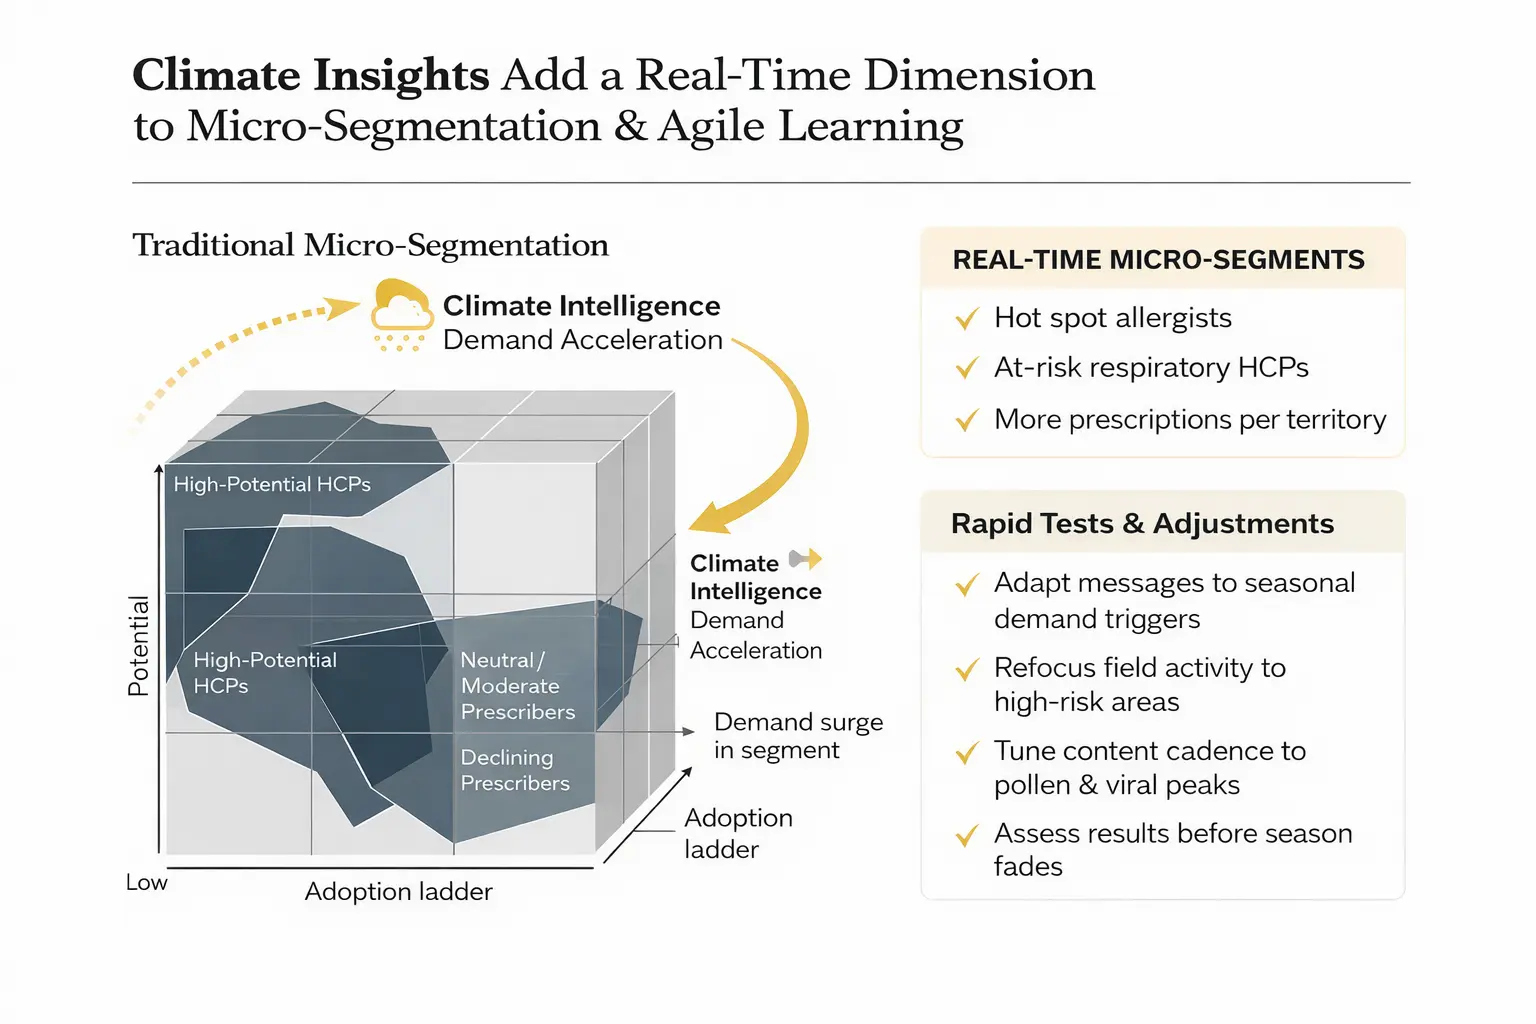
This doesn’t replace prescriber segmentation. It tells you when to act on it.
The commercial case
Ambee’s ClimaChain automates the complex analytics, delivering high-impact territory insights directly to the rep.
(straight from Veeva deck)
Mid-decile prescribers in high-exposure regions become genuine growth opportunities, not afterthoughts. Call frequency aligns with when patients are actually presenting. Campaign timing matches consultation volume. Territory prioritization is driven by expected demand, not just historical deciles.
Without those layers:
Engagement arrives after peak demand. Field effort is spread evenly rather than concentrated. Prescription growth depends partly on whether seasonal timing happens to align with a static call plan.
Instead of a standard pitch, imagine walking into a high-volume allergy, asthma, cold & flu clinic and showing the HCP a 30-day forecast of PM2.5 levels and local ILI reports. It changes the conversation from "please prescribe my drug" to "here is how to prepare for next month's patient surge."
Environmental intelligence provides the following:
When layered onto existing infrastructure, it converts static engagement plans into predictive ones. In allergy and cold & flu categories, where prescriptions follow environmental exposure, that timing gap directly translates into lost opportunity.
Most of the teams we talk to already suspect that timing is the problem. They just don't have the signal to act on it. If that sounds familiar, drop us a note at contactus@getambee.com or see how it works at https://www.getambee.com/products/climachain.
00:00
/
00:00
00:00
/
00:00
00:00
/
00:00
00:00
/
00:00





.webp)