Get the most reliable climate data
Oops! Something went wrong while submitting the form.


Turn climate intelligence into commercial advantage
ClimaChain delivers forward-looking pollen, flu, and weather forecasts that help commercial teams win bigger retailer orders, time campaigns with precision, and hit quota. Coverage is at the postal code and FSA level, updated weekly with a four-week forecast horizon.
Try free demo
Commercial teams in Rx have long relied on prescriber deciles, call plans, and territory design to decide who to visit. These systems identify clinicians who historically prescribe more and do so consistently.
Respiratory and allergy drugs behave differently. As pollen rises, patients come in and prescriptions follow. An analysis of IBM MarketScan claims across 28 U.S. metro areas showed visits for allergic rhinitis and medication fills increased on high pollen days, with seven day cumulative exposure more predictive than same-day levels.
Demand tracks the environment.
A patient in Hamilton or Mississauga does not visit an allergist because of a campaign. They go when local ragweed levels cross a point where symptoms stop being manageable. The exposure comes first, then the visit, then the prescription, and only later does it appear in reporting.
If targeting models cannot see the exposure event, the field team is always reacting to past demand. In environmentally driven categories, that lag has a direct commercial cost.
The phrase "forward-looking intelligence" is used broadly in pharma commercial strategy, often to describe dashboards that are simply faster at displaying historical data. In the context of respiratory and allergy portfolios, the term should mean something more specific.
Forward-looking intelligence in this context means knowing, four weeks in advance, at the postal code or FSA level, where pollen load is building, which allergen types are driving exposure, how current conditions compare to the same period last year, and when the resulting patient demand surge is expected to peak. The granularity matters as much as the lead time.
Respiratory demand does not distribute evenly across a province or a region. A tree pollen surge in Ontario's Hamilton-Burlington corridor can coincide with relatively stable conditions in Toronto's northern suburbs, forty kilometres away. A field force running the same call cadence across both geographies is simultaneously over-investing in one and under-investing in the other, not because of poor execution, but because the targeting model lacks the environmental resolution to distinguish them.
That is the structural gap that climate intelligence addresses.
The Pollen Exposure Index, or PEI, is not a weather metric repackaged for commercial use. Weather data reports atmospheric conditions. Meanwhile, PEI estimates how much allergen exposure a population actually experiences.
It combines forecast pollen levels, allergen mix, and population density into a single geographic intensity score. The output tracks something operational: the likelihood that symptoms in that area will worsen. As PEI rises, consultations tend to rise with it, followed by therapy adjustments.
For teams managing respiratory therapies or allergy biologics, PEI acts as an early signal of prescribing demand.
Instead of waiting for prescription data:
Exposure increases → patients worsen → visits rise → prescriptions appear in reports
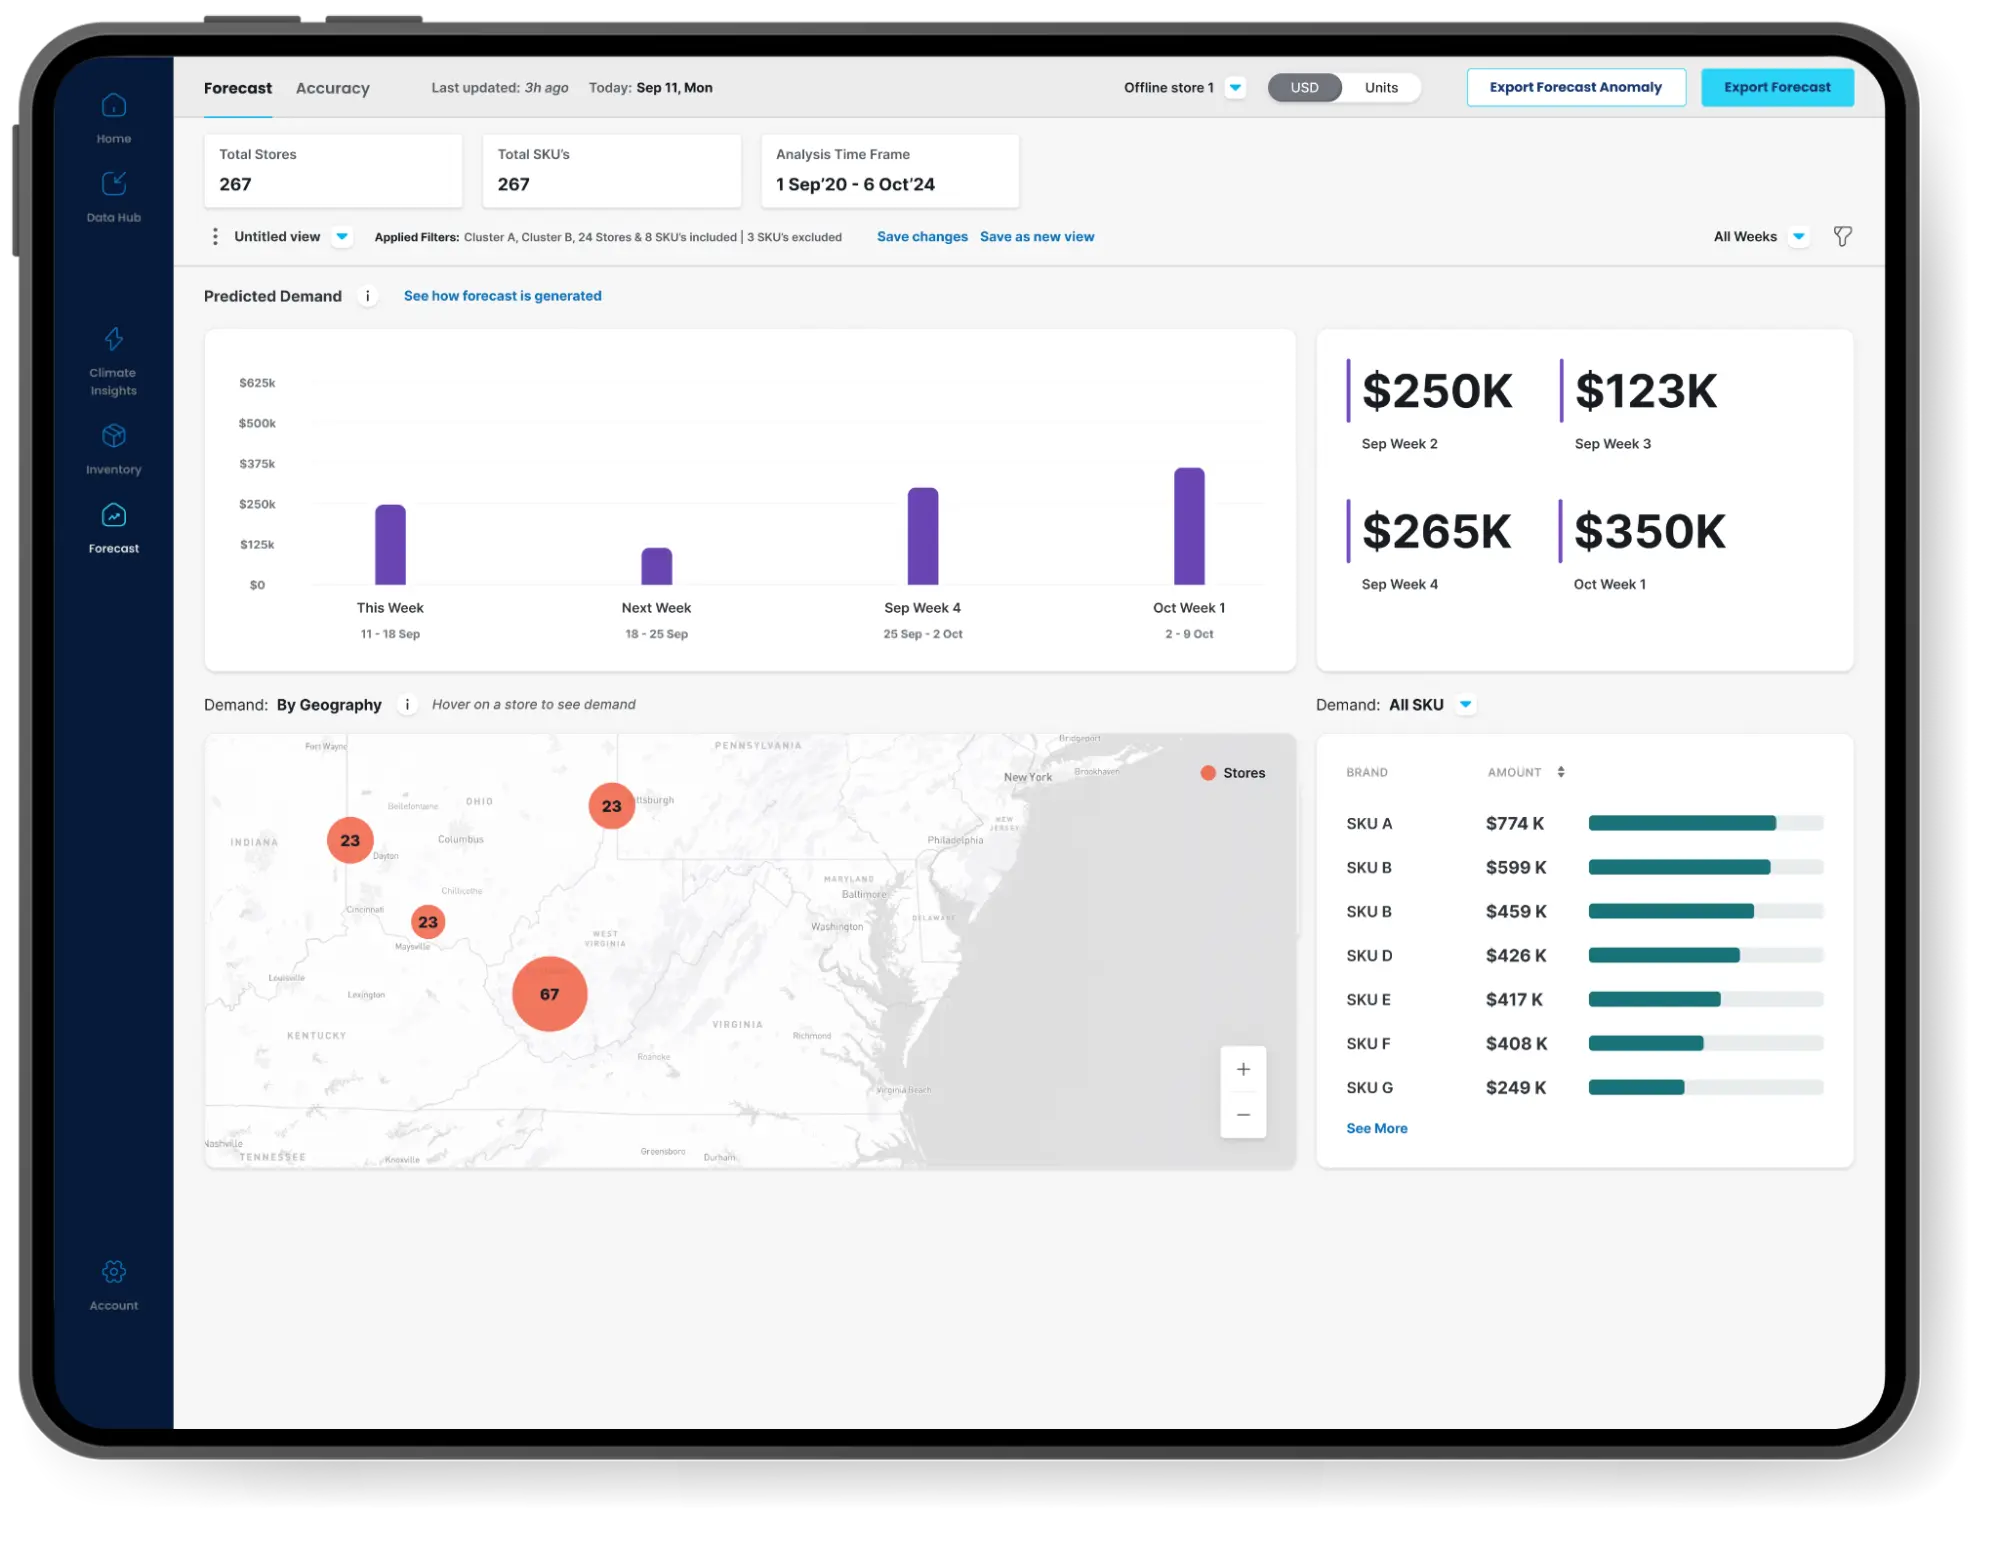
The map shows the first step.
A weekly updated view, four weeks ahead, highlights where visit volume is likely to grow before prescribing data registers the change.
Respiratory demand does not move uniformly across a province. Conditions can diverge within short distances. A single cadence across all territories therefore allocates effort unevenly. The issue is not planning discipline but lack of exposure visibility.
Hover on any geography:
Drill down without losing context:
Province → city → postal code
If tree pollen week 3 is selected, that filter persists through every level.
For teams that currently assemble this picture across multiple tools, consolidating it into one navigable view changes daily workflow.
An exposure score helps explain conditions, but field teams act on priority lists. Field deployment decisions require prioritization, and prioritization requires rank.
PEI Rank orders every geography in the platform by exposure intensity relative to all others. The top 100 postal codes by PEI Rank represent the highest-concentration pollen environments nationally within any given forecast window. Ranks 101 through 200 represent elevated risk. The scale continues through 600 and beyond, covering the full geographic footprint of the deployed territories.
Traditional view:
High decile prescribers → stable focus
With exposure rank:
High decile + low exposure → steady performance
Mid decile + high exposure → near term growth opportunity
The second case appears because patient volume is expected to rise regardless of promotion.
Overlaying PEI Rank on prescriber segmentation points to clinicians about to see more symptomatic patients instead of those who only prescribed more historically.
PEI Rank provides the mechanism to identify that second prescriber in time to act on it.
An exposure score helps explain conditions, but field teams act on priority lists. Field deployment decisions require prioritization, and prioritization requires rank.
PEI Rank orders every geography in the platform by exposure intensity relative to all others. The top 100 postal codes by PEI Rank represent the highest-concentration pollen environments nationally within any given forecast window. Ranks 101 through 200 represent elevated risk. The scale continues through 600 and beyond, covering the full geographic footprint of the deployed territories.
What this adds to targeting
Traditional view:
High decile prescribers → stable focus
With exposure rank:
High decile + low exposure → steady performance
Mid decile + high exposure → near term growth opportunity
The second case appears because patient volume is expected to rise regardless of promotion.
Overlaying PEI Rank on prescriber segmentation points to clinicians about to see more symptomatic patients instead of those who only prescribed more historically.
PEI Rank provides the mechanism to identify that second prescriber in time to act on it.
PEI and PEI Rank show where exposure is building. Peak Demand Window answers the next question: when that exposure will turn into prescribing activity.
Peak pollen and peak prescribing do not occur at the same time. There is a predictable delay between them.
As Dr. William Berger, MD, of the Allergy & Asthma Network explains:
“You should start taking [allergy medications] anywhere from 2 to 4 weeks before your allergy season begins.”
Patients who follow this guidance visit physicians before pollen peaks. Prescriptions therefore rise ahead of the environmental maximum. The length of this lead varies by geography and reflects real patient behavior in that territory.
Instead of showing only exposure risk, the model applies observed behavioral lag to forecast pollen periods.
Output format: ISO week range
Example: Week 08–Week 10
Meaning: elevated prescribing probability from the start of week 8 through the end of week 10, regardless of the exact pollen peak.
Field teams do not have to interpret exposure curves or adjust timing themselves. They receive an activation window that already accounts for it.
This changes how effort fits inside a quarter. Instead of distributing activity evenly across twelve or thirteen weeks, teams can concentrate work during the periods when consultation volume is expected to rise. The targeting framework (prescribers, territories) stays intact. The schedule adjusts to when patients actually present.
For brand planning, the same logic applies at the campaign level. Here's an example:
High grass pollen in southeastern Ontario: weeks 13–16
Instead of uniform national support:
- HCP digital support intensifies in that window
- Field activation aligns with expected consultation volume
Planning moves from calendar-driven to demand-timed.
Any new analytical layer in a commercial workflow has to show a measurable impact before it earns budget. Climate-attributed demand analysis provides that measurement.
The model splits historical prescription volume into two parts:
Both appear as separate lines across a 52 week time series alongside actual sales, so teams can observe the historical relationship before using it for planning.
Results are expressed as a percentage by province, and the differences across markets are large. Some provinces show roughly 20% to 25% of prescriptions moving with environmental exposure. Others show little sensitivity. This variation indicates where forward looking climate intelligence is likely to matter commercially.
For Commercial Excellence leaders, the analysis turns a general hypothesis into a quantified one. The share of climate-attributed demand identifies which territories merit priority when forecasts rise and which remain relatively stable across the season.
The individual components above are more useful together than on their own. A planning scenario shows how they connect.
A Commercial Excellence team preparing call plans for an allergy biologic across Canadian provinces opens the Climate Analytics module. The starting view is the Impact by Province table. For each province it shows current pollen risk, year over year change, PEI score, PEI Rank, Optimal Lag, and Peak Demand Window in one place.
Three provinces display PEI Ranks within the national top 100 and Peak Demand Windows within the next four ISO weeks.
The team drills down. The view shifts to Impact by City. Hamilton, Brampton, and Kitchener appear in the highest tree pollen exposure tier for the current forecast window. Selecting Hamilton opens Impact by Postal Code, where each FSA shows exposure load and demand window alongside territory name and code.
They then create a segment: PEI percentile above 75, Peak Demand Window between W08 and W10, and population above a defined threshold. The platform returns the matching postal codes and an estimated location count. The list is exported as a CSV and shared with field reps as a climate-prioritized call list alongside existing prescriber rankings.
A climate alert is configured to trigger when any province enters High or Very High pollen risk within the four week forecast horizon. The notification arrives automatically once the threshold is crossed. No one needs to monitor the dashboard.
From opening the platform to exporting the target list and setting the alert takes only a few minutes within a single planning session.
The forward looking components of climate intelligence support planning. The retrospective view supports the business case.
Missed Opportunity by Risk Level is presented as a bar chart. For each pollen category, the chart shows the volume of demand that occurred in locations with below plan coverage during those environmental periods.
The data is historical. It measures what timing misalignment between exposure and field activity cost, broken down by risk level, week, and geography.
For brand and commercial leaders seeking budget for environmentally informed allocation, this chart provides the evidentiary layer. If a defined share of demand during High and Very High risk weeks occurred in territories where call activity was under plan, the financial impact is visible. The argument for adjusting deployment logic rests on observed performance, not projection.
When paired with forward-looking Peak Demand Windows, the narrative becomes complete.

The same environmental intelligence platform serves two distinct planning functions in an Rx commercial organization, and the outputs that matter most differ by role.
Commercial Excellence leaders are primarily asking where field resources should be concentrated and in which ISO weeks. PEI Rank, Peak Demand Windows, and Impact Tables at the postal code and territory level answer those questions directly. The operational output is a modified call plan with climate-adjusted territory prioritization.
Brand Directors are primarily asking whether campaign investment is landing in the windows when patient consultation volume is highest. Pollen-sales correlation analysis addresses that question. When correlation data shows that prescription velocity in a geography tracks closely with environmental exposure peaks, the implication for campaign timing is direct: media bursts, sampling activation, and HCP-facing digital support should align with environmental windows rather than fixed quarterly schedules. A campaign concentration in week 10 for a territory where the demand window runs weeks 13 through 16 is spending against a gap, not an opportunity.
The environmental intelligence required to answer both questions comes from the same underlying data. The planning application and the internal audience for each output differ, and that distinction matters for how these insights are structured and presented within a commercial organization.
The Pollen Exposure Index is a geography-specific score that quantifies allergen intensity by integrating forecasted pollen levels, allergen type, and population exposure density into a single metric. In pharmaceutical commercial strategy, it functions as a leading indicator of patient visit volume, giving field force and brand teams a forward view of where prescribing demand is likely to increase before historical prescription data reflects that movement.
A Peak Demand Window is an ISO week range during which demand for respiratory or allergy therapies is expected to be elevated. It is calculated by applying a historically observed lag between peak environmental exposure and peak prescribing activity to the current pollen forecast. The output gives field teams a directly actionable activation window for each territory, without requiring manual interpretation of pollen data.
Baseline demand is the stable, chronic prescription volume that occurs independent of environmental conditions. Climate-attributed demand is the incremental volume that correlates with environmental exposure peaks, such as elevated pollen or ILI risk levels. Separating these components allows commercial teams to quantify how much of a territory's historical performance is environmentally driven, and to identify which geographies carry the highest sensitivity to environmental forecasting.
Pollen forecasts provide a four-week forward view of allergen intensity at the postal code and FSA level. Brand teams can use this data to align HCP-facing campaign activation, including digital, field, and sampling activity, with the environmental windows that drive patient consultation volume. Aligning campaign timing to demand windows rather than fixed quarterly schedules reduces the portion of spend that lands outside periods of active patient-seeking behavior.
PEI measures raw environmental exposure intensity within a specific geography. PEI Rank orders all geographies in the dataset relative to each other based on that intensity score. PEI indicates how severe exposure is in absolute terms. PEI Rank enables prioritization by establishing where a geography stands relative to all others, which makes it the more actionable metric for field force targeting and resource allocation decisions.
The foundational relationship between environmental exposure and prescribing demand in respiratory and allergy categories is not in dispute. Most experienced brand and field leaders have observed it across multiple seasons and accept it as a structural feature of these therapeutic areas.
The question that remains open for most commercial organizations is whether that relationship has been incorporated into targeting logic or whether the targeting model is still operating on the assumption that all geographies are environmentally equivalent, all weeks within a quarter are equally productive for field activation, and the primary variable worth tracking is what prescribers did in the previous reporting period.
If the targeting model reflects the latter, a portion of commercial budget is being deployed against an incomplete picture of where and when demand will materialize. Some investment lands too early relative to the demand window. Some lands after the window has passed. Some reaches the right geography but at a point in the forecast horizon where environmental pressure has already subsided. The cumulative effect does not appear as a single identifiable failure. It appears as performance variability that gets attributed to messaging quality, market conditions, or execution consistency, when the root cause is a timing and geography problem.
Environmental intelligence built specifically for commercial planning closes that gap. For respiratory and allergy portfolios where the environmental trigger precedes every prescription, building that intelligence into targeting and campaign planning is a structural improvement, not an incremental one.
{{key-insights}}


.webp)