Resources /
Blogs
How allergy brands can use ClimaChain’s climate insight for smarter territory planning
August 28, 2026
Anshu Singh

Pharma field teams have long known the correlation between pollen and a spike in allergy symptoms, and while it's a widely understood context, it's hard to operationalize at the same time. This became one of our major problem statements during the initial stages of building ClimaChain. During our research, we put a lot of emphasis on what the data was revealing. When we figured out the correlation between pollen spike and sales was 71%, we dug deeper to see how this could be better quantified and translated into commercial decisions, be it precision targeting for HCP campaigns or territory allotment for field teams.
In this explainer, I will explain ClimaChain’s Climate insights module and how any brand director or territory manager can start making commercial decisions in just a few clicks.
But before that, here’s the problem that's actually blocking engagement opportunities for allergy Rx field teams
Field reps work off a visit calendar built months ago, usually in the prior quarter. The calendar looks reasonable on paper: territories are distributed, call frequency is mapped, and the whole thing feels planned.
Then the pollen season begins, and because nothing in that calendar is connected to what's actually happening environmentally in each territory, your reps don't know which zip codes are entering a high-risk phase, they don't know that tree pollen is about to spike sharply in the northern part of their territory while the south stays moderate, and they certainly don't know that an HCP three blocks away is about to start seeing three times their normal allergy patient volume starting next Tuesday.
So what do they do with that absence of information? They stick to the calendar, and they very well do so. Visit sequence stays the same, call frequency stays the same, and the rep shows up wherever the schedule says to show up, regardless of what's happening in the environment around their territory.
Meanwhile, the clinical moment is happening. An HCP is managing an elevated patient load. They are actively looking for support, actively thinking through therapy options, and more receptive to a relevant commercial conversation than at almost any other point in the year, and your rep doesn't know about it because the only data they have access to is Rx data, which by the time it surfaces is already one to two weeks behind reality. So they find out about the spike after it's already normalized, and the peak engagement window, the time when the HCP was most receptive and most in need, has already closed.
This is exactly the friction I kept hearing from territory managers and commercial excellence leaders too. Everyone knows that pollen matters, and everyone knows when it spikes and patients come in, but there is no way to know when that's happening in real time or beforehand in r specific territoriesThat's what ClimaChain’s Climate insights is built to solve, not by creating a new data literacy requirement for your field team, but by taking the pollen forecast and making it visible, geographic, and immediately actionable at the territory level.
Throughout the module, you'll see three terms that help field teams understand where risk is accelerating, and when engagement opportunities are most likely to emerge.
PEI (Pollen Exposure Index) is a 0-100 composite score measuring how strongly people in a location are exposed to pollen risk. Derived from forecasted pollen intensity with population vulnerability by age group.
Pollen anomaly identifies locations where risk is rising faster than prior-year plans account for.
Peak demand window forecasts the periods when HCPs are most likely to experience elevated allergy patient volumes by applying the optimal lag between rising pollen levels and patient visits.
With those concepts in mind, let me explain how the platform works in practice.
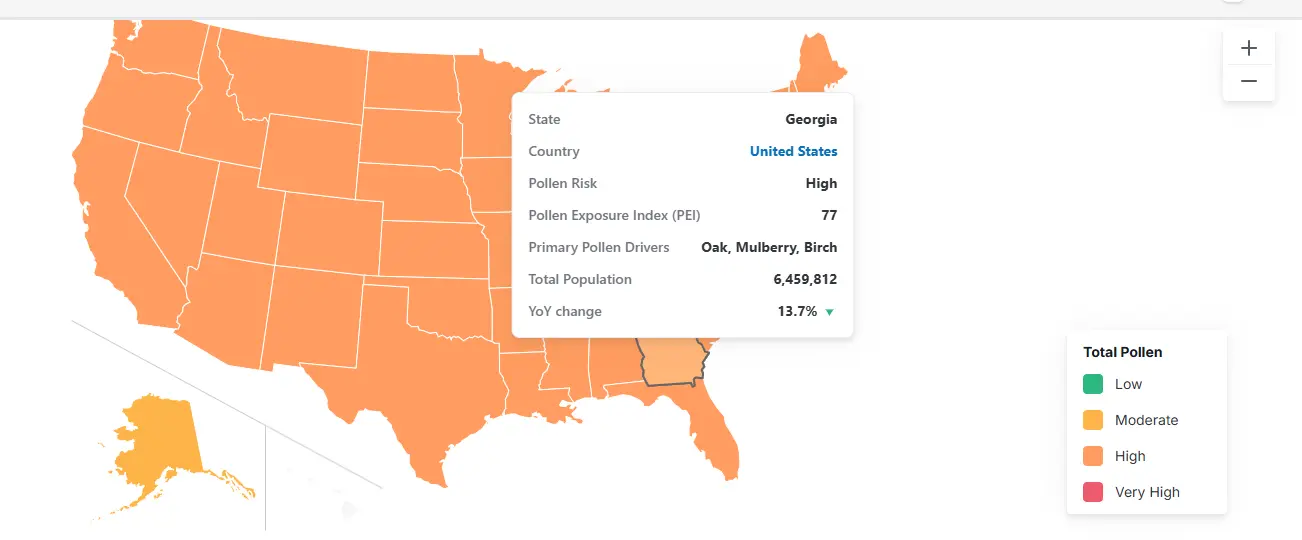
The first thing you see when you open Climate insights is a map, The map is color-coded by pollen risk intensity, updated every week based on the forecast, and it covers the next four weeks of outlook. The map shows county-level risk across the country, and it shows real variation within territories that most commercial teams have never had visibility into before. The northern half of a territory might be entering a very high tree pollen risk while the southern half stays moderate, which means a territory manager who treats both areas the same way this week is over-allocating resources in one direction and missing an opportunity in the other.
The other thing this map does that changes the practical workflow is drill-down, which empowers the following roles:
The whole chain from national strategy to individual call planning at the zip-code level runs through the same map, with the same data, in the same direction, helping all internal stakeholders see in a single view and plan field and promotional activities well in advance.
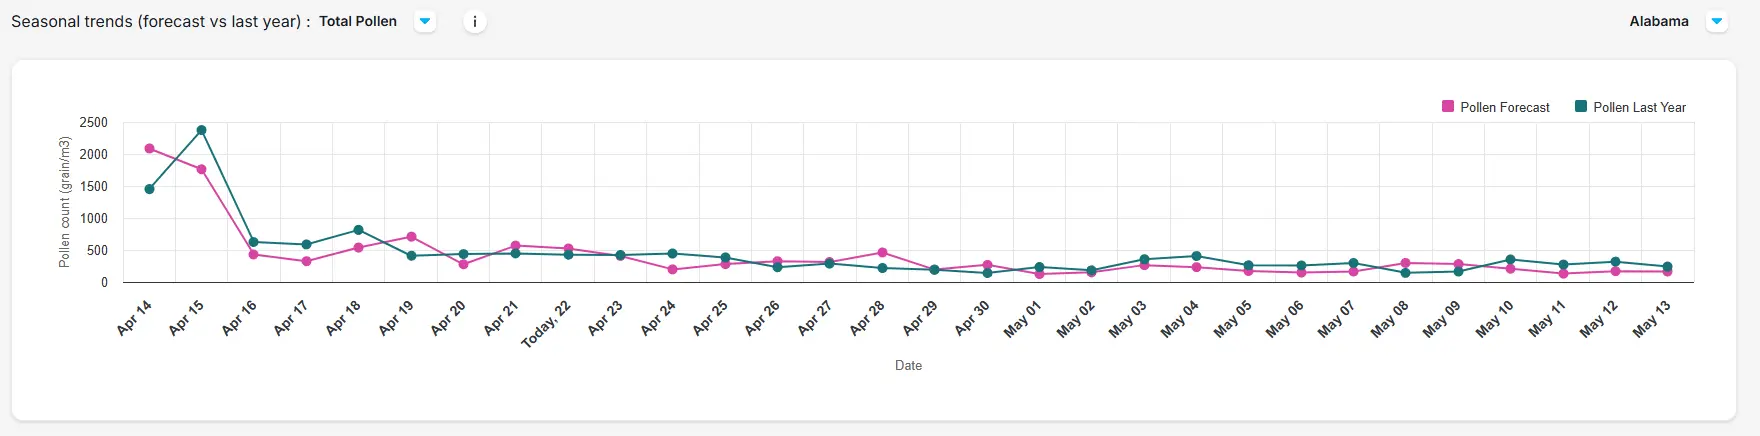
In some US territories, the demand response to pollen is threshold-driven, meaning that moderate pollen exposure for weeks barely moves the needle on patient consultations, but once pollen crosses into the high range, you see a sharp and relatively sudden lift in physician visits. Patients who have been managing with OTC remedies or just tolerating symptoms cross a threshold where they seek care, and that happens within a fairly compressed window once pollen gets high enough. If your territory shows this kind of threshold pattern, the implication is specific: the strategic moment is not when pollen is already very high and patient volume is already elevated, but in the two to three weeks before pollen crosses the high threshold, when you can get in front of HCPs before the surge, brief them on what's coming, and position your allergy prescription brand as the first thing they reach for when patient flow builds.
In other territories, the relationship is more gradual and linear, where demand rises steadily as pollen moves from low to moderate to high, which calls for a different kind of engagement rhythm. And in still others, particularly those with high concentrations of severe allergy patients, very high pollen levels trigger a different clinical dynamic than high pollen, with more urgent presentations and more therapy switching conversations happening. Climate insights shows you which of these patterns characterizes each of your territories, and what that does practically is give brand directors and territory managers a basis for territory-specific activation planning rather than applying a single national playbook to geographies that respond to the environment in fundamentally different ways.
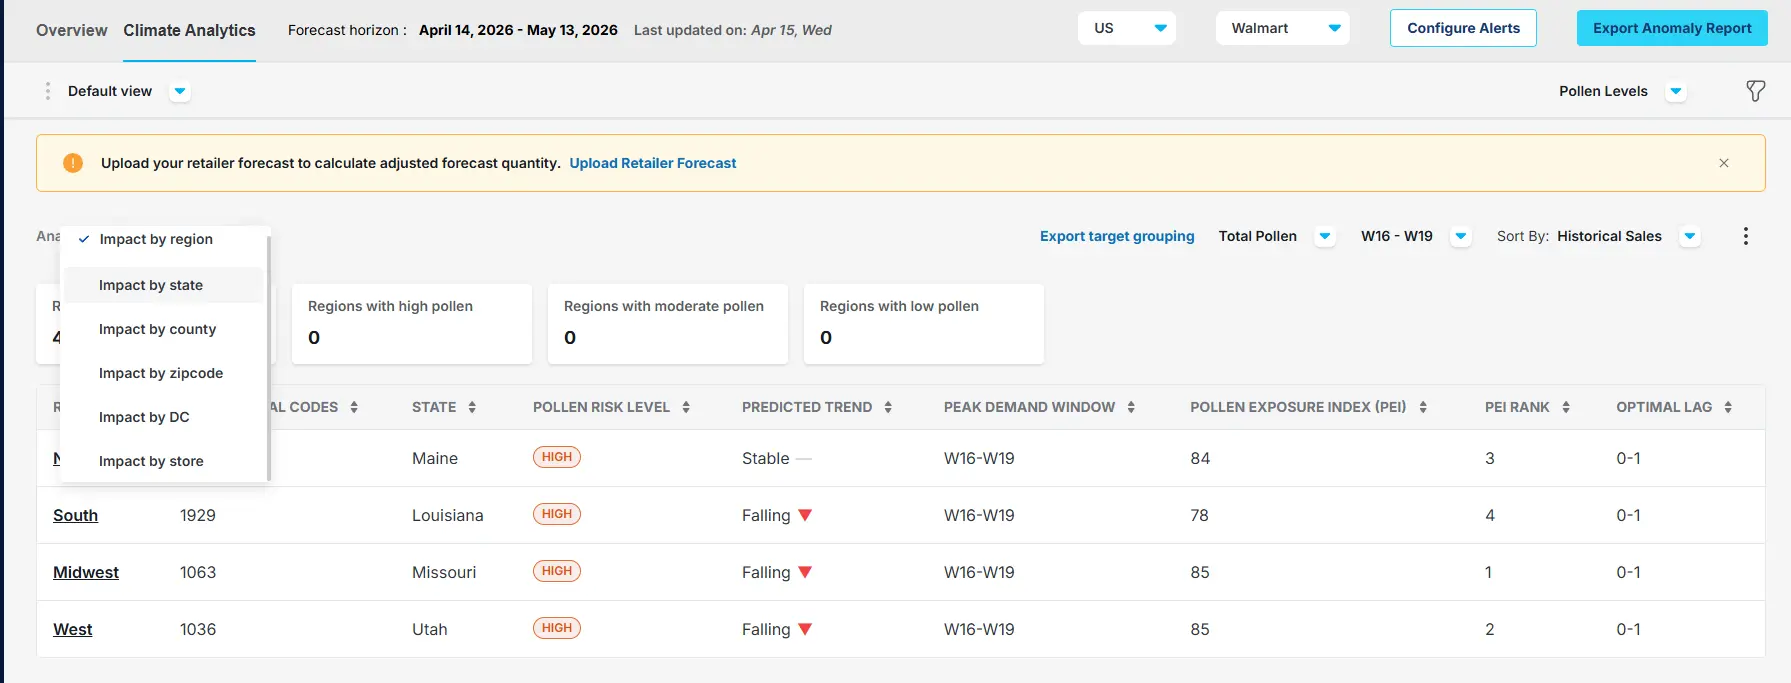
The third piece of ClimaChain’s Climate Insight module is where the strategy becomes a list of addresses. You start at the regional level to understand where the biggest pollen story is playing out nationally this week, which gives commercial excellence leaders the context they need to make resource allocation decisions and campaign prioritization calls at the macro level.
You then go to the state level to identify which markets within the priority regions are moving fastest, which is where a brand director starts making decisions about where to concentrate promotional activities, sales support, co-op spend, and field force effort in the current window.
From the state, you go to the county, which is where territory managers are making their real decisions about call frequency and rep deployment, and from the county, you can drill all the way to the zip code, which gives you the specific postal codes where pollen risk is rising and where HCP patient volumes will follow.
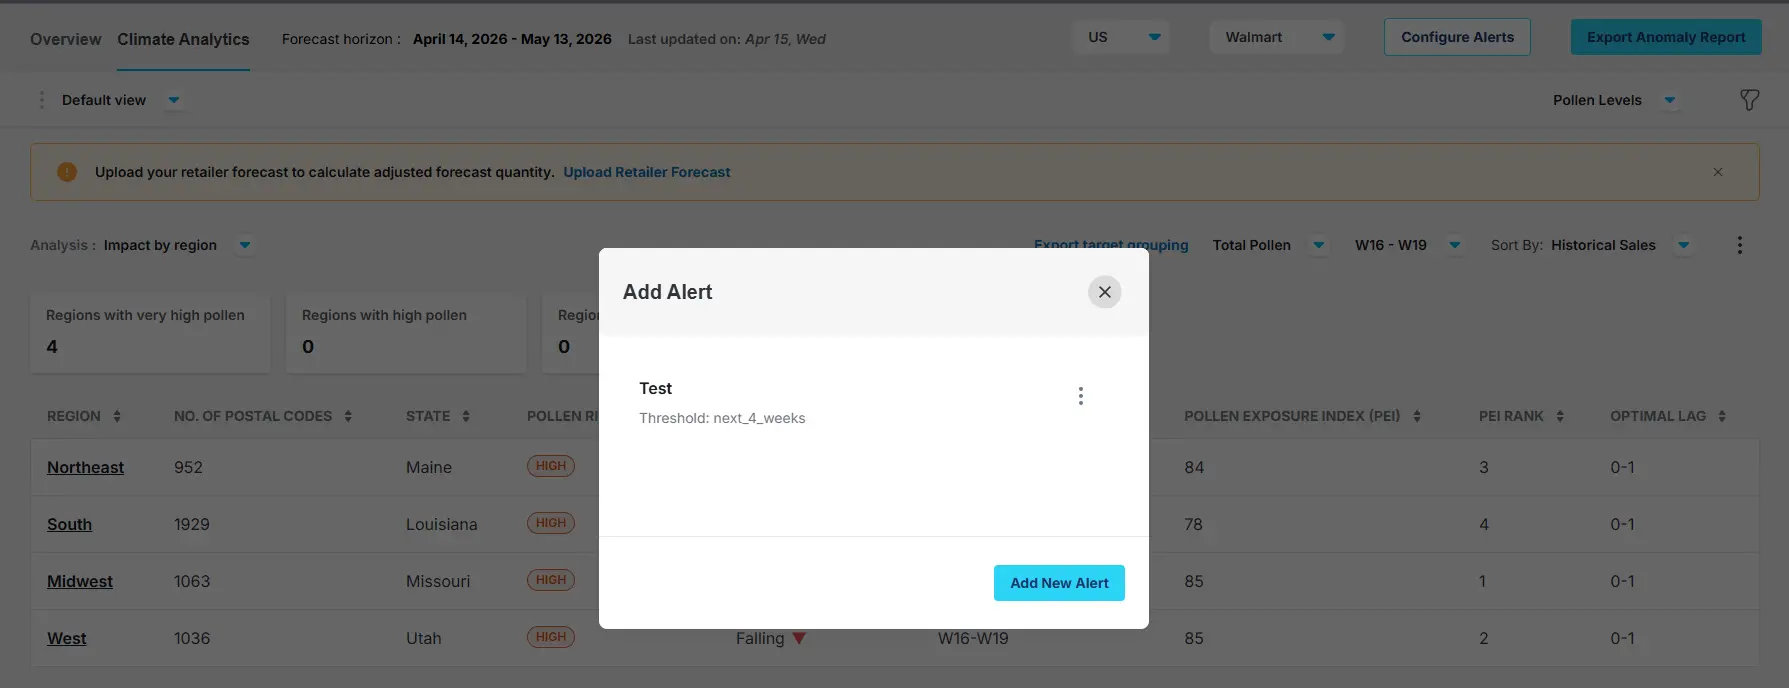
The thing that matters most is the target list that comes out at the end of the drill-down. It's a ranked list of specific zip codes and geographic areas where pollen risk (PEI - Pollen Exposure Index) is elevated or rising right now, where demand is forecast to spike based on the optimal lag in those territories, and where a rep showing up this week or next week is showing up at the right clinical moment rather than a random point on the calendar.
Before ClimaChain, the feedback loop that field teams operated on was backward-looking by necessity, because the only real-time signal available was Rx data. After ClimaChain, that feedback loop inverts. The pollen forecast is a forward-looking signal, and it gives your team visibility into rising risk before it translates into prescriptions, which is exactly the window where commercial engagement has the highest return.
You can identify HCPs likely to face rising patient volumes before the surge begins. That enables smarter call planning, targeted outreach, and region-specific collateral that reflects the environmental realities physicians are seeing.
Here is the simplest way I can frame what ClimaChains’ Climate insights does for commercial teams in allergy. The shift is from knowing pollen impacts allergy demand, which everyone already knows, to knowing exactly where and when pollen is creating patient demand in your specific territories and being positioned to engage there before the window closes rather than after it's opened.
In a time-sensitive category, that shift is the underlying mechanism that separates teams that consistently hit engagement windows from teams that are perpetually one week late to the conversation that mattered most.
Book a free demo and see how your territories actually respond to pollen intensity levels, because once you know that, the guesswork in allergy commercial planning mostly disappears.
00:00
/
00:00
00:00
/
00:00
00:00
/
00:00
00:00
/
00:00








.webp)