Access real-time drought data for smarter resource decisions
Monitor drought events globally with event-specific data, including location, history, and alert levels, all through one developer-friendly API.
Monitor drought events globally with event-specific data, including location, history, and alert levels, all through one developer-friendly API.


Water is the substance life depends on, which is what makes droughts so devastating. And they are. In 2011, after two failed rainy seasons across the Horn of Africa, Somalia’s famine claimed 260,000 lives. Half were children under the age of five.
Loss on that scale is impossible to fully comprehend. But organizations can defend themselves.
United Nations
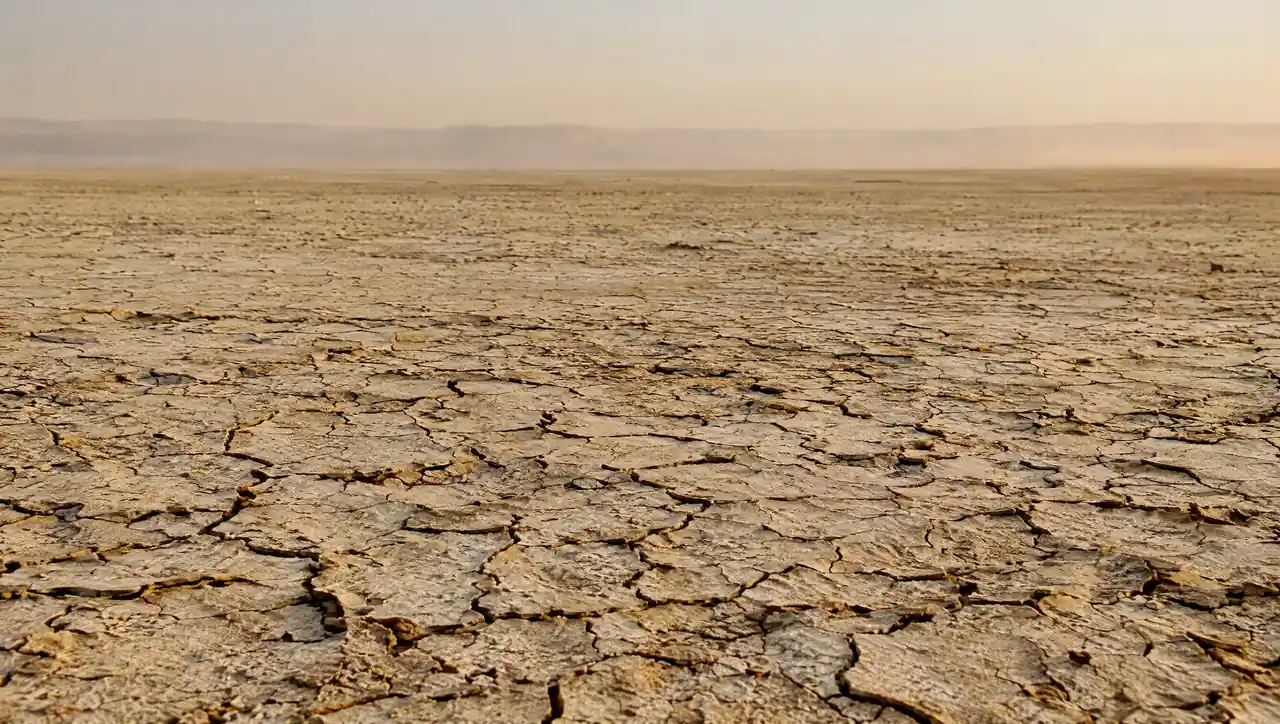

It's too late by the time drought damage appears at harvest. Ambee helps cooperatives, agronomists, and crop planners monitor rainfall deficits as they develop, allowing management of irrigation resources.

Drought has driven 41% of US crop insurance indemnities since 2000, yet much of that exposure is still priced using broad regional averages. Ambee provides underwriters with granular drought history to support parametric products.

Ambee helps procurement and sourcing teams monitor drought stress across coffee, sugar, dairy, and agricultural regions early enough to adjust sourcing and secure supply before shortages intensify.

Drought is responsible for 85.8% of livestock deaths globally. Hyperlocal drought data quantifies exposure across operations, suppliers, and water-stressed geographies.

Track drought conditions across 150+ countries with precise event data that maps to areas where impacts actually land.

Track drought events as conditions evolve and access historical records to identify recurring drought zones.

Our verified, high-fidelity drought data pulls from satellite, government monitoring systems, and expert-validated environmental assessments.

Ambee's API delivers drought intelligence directly into dashboards and operational systems without specialized domain expertise or complex onboarding.


const http = require("https");

const options = {
	"method": "GET",
	"hostname": "api.ambeedata.com",
	"port": null,
	"path": "/disasters/processed/latest/by-lat-lng?lat=37.7823&lng=-122.3912&eventType=DR",
	"headers": {
		"x-api-key": "API_KEY",
		"Content-type": "application/json"
	}
};

const req = http.request(options, function (res) {
	const chunks = [];

	res.on("data", function (chunk) {
		chunks.push(chunk);
	});

	res.on("end", function () {
		const body = Buffer.concat(chunks);
		console.log(body.toString());
	});
});

req.end();
const http = require("https");
const options = {
"method": "GET",
"hostname": "api.ambeedata.com",
"port": null,
"path": "/disasters/processed/latest/by-lat-lng?lat=37.7823&lng=-122.3912&eventType=DR",
"headers": {
"x-api-key": "API_KEY",
"Content-type": "application/json"
}
};
const req = http.request(options, function (res) {
const chunks = [];
res.on("data", function (chunk) {
chunks.push(chunk);
});
res.on("end", function () {
const body = Buffer.concat(chunks);
console.log(body.toString());
});
});
req.end();const http = require("https");
const options = {
"method": "GET",
"hostname": "api.ambeedata.com",
"port": null,
"path": "/disasters/processed/latest/by-lat-lng?lat=37.7823&lng=-122.3912&eventType=DR",
"headers": {
"x-api-key": "API_KEY",
"Content-type": "application/json"
}
};
const req = http.request(options, function (res) {
const chunks = [];
res.on("data", function (chunk) {
chunks.push(chunk);
});
res.on("end", function () {
const body = Buffer.concat(chunks);
console.log(body.toString());
});
});
req.end();const http = require("https");
const options = {
"method": "GET",
"hostname": "api.ambeedata.com",
"port": null,
"path": "/disasters/processed/latest/by-lat-lng?lat=37.7823&lng=-122.3912&eventType=DR",
"headers": {
"x-api-key": "API_KEY",
"Content-type": "application/json"
}
};
const req = http.request(options, function (res) {
const chunks = [];
res.on("data", function (chunk) {
chunks.push(chunk);
});
res.on("end", function () {
const body = Buffer.concat(chunks);
console.log(body.toString());
});
});
req.end();const http = require("https");
const options = {
"method": "GET",
"hostname": "api.ambeedata.com",
"port": null,
"path": "/disasters/processed/latest/by-lat-lng?lat=37.7823&lng=-122.3912&eventType=DR",
"headers": {
"x-api-key": "API_KEY",
"Content-type": "application/json"
}
};
const req = http.request(options, function (res) {
const chunks = [];
res.on("data", function (chunk) {
chunks.push(chunk);
});
res.on("end", function () {
const body = Buffer.concat(chunks);
console.log(body.toString());
});
});
req.end();<?php
$curl = curl_init();
curl_setopt_array($curl, [
CURLOPT_URL => "https://api.ambeedata.com/disasters/processed/latest/by-lat-lng?lat=37.7823&lng=-122.3912&eventType=DR",
CURLOPT_RETURNTRANSFER => true,
CURLOPT_ENCODING => "",
CURLOPT_MAXREDIRS => 10,
CURLOPT_TIMEOUT => 30,
CURLOPT_HTTP_VERSION => CURL_HTTP_VERSION_1_1,
CURLOPT_CUSTOMREQUEST => "GET",
CURLOPT_HTTPHEADER => [
"Content-type: application/json",
"x-api-key: API_KEY"
],
]);
$response = curl_exec($curl);
$err = curl_error($curl);
curl_close($curl);
if ($err) {
echo "cURL Error #:" . $err;
} else {
echo $response;
}curl --request GET \
--url 'https://api.ambeedata.com/disasters/processed/latest/by-lat-lng?lat=37.7823&lng=-122.3912&eventType=DR' \
--header 'Content-type: application/json' \
--header 'x-api-key: API_KEY'url = URI("https://api.ambeedata.com/disasters/processed/latest/by-lat-lng?lat=37.7823&lng=-122.3912&eventType=DR")
http = Net::HTTP.new(url.host, url.port)
http.use_ssl = true
request = Net::HTTP::Get.new(url)
request["x-api-key"] = 'API_KEY'
request["Content-type"] = 'application/json'
response = http.request(request)
puts response.read_body{
"message": "success",
"hasNextPage": false,
"page": 1,
"limit": 10,
"result": [
{
"event_type": "DR",
"alert_level": null,
"city": "Glan",
"continent": "asia",
"country_code": "PHL",
"created_time": "2026-06-08 00:48:57",
"date": "2026-06-07 23:38:00",
"details": {
"magnitude": 7.8,
"depth": 63,
"waveheight": null,
"impact": null,
"death": null,
"injured": null,
"affected": null
},
"end_date": null,
"estimated_end_date": "2026-06-08 00:00:00",
"event_id": "d44292b2a11f73f0e2bd6fa0ff159f40",
"event_name": "drought at in Mindanao, Philippine Islands",
"expiry_time": "2026-07-07 23:38:00",
"lat": 5.7,
"source_event_id": "noasu_tgacbc",
"state": "Soccsksargen",
"type": "event",
"lng": 125.2,
"proximity_severity_level": "High Risk"
}
]
}
Sign up for an Ambee account and generate your API key from the dashboard.
Select the endpoint based on what you need.
Specify the location using latitude and longitude coordinates, ZIP codes, or custom boundaries.
Include your API key in the request header and call the endpoint. You'll receive pollen counts, species-level data, and risk classifications in JSON format.
Real feedback from real innovators












Monitor developing storm systems to stay ahead of severe weather.

Track present and forecast temperature conditions across any location.
Get present tornado tracking to support faster, safer decisions.

Follow hurricane formation and movement to plan around coastal risk.

Follow cyclone formation and movement to plan around regional risk.

Monitor seismic activity as it happens to assess exposure.

Track how severe storms increase rainfall-driven erosion and terrain instability.
Track how severe storms increase rainfall-driven erosion and terrain instability.

Monitor flood risk as conditions develop to protect people and assets.

Track how severe storms increase rainfall-driven erosion and terrain instability.

Track how severe storms increase rainfall-driven erosion and terrain instability.

Common questions about Ambee's drought data
Drought API is a subset of natural disaster data that provides access to real-time and historical drought data.
The drought API supports various data formats, including JSON, Excel, CSV, Parquet, and XML, to meet user needs.
Drought API includes response parameters such as location, date, drought indices, precipitation data, and soil moisture levels.
Yes, the drought API provides global coverage. It offers hyper-local data from over 150 countries and continues to expand its coverage.
Ambee collects data from multiple trusted sources, including global seismic monitoring networks such as GDACS, USGS, NOAA, NASA, and COPERNICUS, to ensure maximum accuracy.
Ambee collects data from various sources, such as satellite imagery, on-ground sensors, and proprietary models. Our data undergo extensive testing and validation to ensure it meets industry standards for quality and efficiency.
The drought data is updated in near real-time as new events occur, and monitoring agencies update forecasts. Each source updates individually; the best case is six hours.
Businesses can utilize Ambee’s drought data for risk assessment, water management, early warning systems, and regulatory compliance.
Yes, Ambee offers global access to its drought data.
Sign up on the Ambee API dashboard and get free access to 100 API calls for 15 days.