Get Access To Street-Level Pollen Count With Ambee

Ambee’s NAB-compliant pollen API provides the most accurate pollen count data. Stay clear of high pollen areas, prepare for health risks, and evaluate long-term trends with real-time pollen data. 

Pollen Count Data
Berlin
Pollen count
68 pollen particles/m3
pollen count data
London
Pollen
count
150 pollen particles/m3
pollen data forecast
Scranton
Pollen count
174 pollen particles/m3
The tree pollen level at
your customer’s locality
is 210. Send alerts
Live Pollen Count Heatmap

What is Pollen Count?

Pollen count measures the number of pollen grains per cubic meter of air. Pollen counts of 50 or less are considered low, while 500 or more is high. These measures can differ according to pollen type. The higher the pollen index, the greater the chance that people suffering from hay fever will experience symptoms when they are outdoors or exposed to outdoor air.

30 % World population experiences allergic rhinitis (hay fever)

30%

World population experiences allergic rhinitis (hay fever)

$18B/yr spent on chronic allergy treatments in the US alone

$18B/yr

leading cause of chronic illness in the U.S is allergies

100m+ Spike in respiratory ailments annually in the US alone

6th

leading cause of chronic illness in the U.S is allergies

Types of Pollen That May Trigger Your Allergies

There are three main types of pollen: tree pollen, grass pollen, and weed pollen, and under them feature a multitude of sub-species of each type.

Pollen type

Tree

Weeds

Grasses

Unidentified

Pollen (34)

Juniper sp.
Acer
Morus alba
Betula

Artemisia sp.
Cannabis sativa
Amaranthus sp.
Chenopodium album
Helenium autumnale
Parthenium

Pooideae grasses (e.g. Poa sp., Loliumperenne, Dactylisglomerata)
Cynodon dactylon

Pollen (count/m3), n%

1310 (18.45)
162 (2.28)
268 (3.77)
192 (2.70)

368 (5.18)
305 (4.29)
298 (4.20)
260 (3.66)
194 (2.73)
137 (1.93)

485 (6.83)


284 (2.84)

1897 (26.72)

Managing Pollen Allergies Starts With Awareness

The presence of pollen in the air can cause sensitive groups to experience symptoms such as sneezing, watery eyes, itchy throat, and eyes, wheezing. Pollen can also lead to allergic rhinitis (hay fever) and aggravate asthma symptoms. 

The allergies can be categorized into tree pollen allergy, weed pollen allergy, and grass pollen allergy. 

Pollen Seasons
allergy dataset

Tree pollen

is responsible for most spring pollen allergy symptoms. It also often overlaps with grass pollen in the spring and summer. 

accurate pollen data

Grass pollen

 allergy affects people depending on their location. In Northern U.S, grass pollen appears in the late spring or early summer. In the South, grasses may release pollen during many seasons and could trigger symptoms throughout the year.

Real-time pollen Data

Weed pollen

 especially ragweed, causes allergy symptoms for many. About 15% of people in the US are allergic to ragweed pollen. Weed pollen appears in the late summer and fall.

Accurate and NAB-Standard Pollen APIs for Your Use Case


Ambee, provides global pollen data with a demonstrably high degree of accuracy and street-level granularity. Ambee's proprietary pollen data is generated by combining data from proprietary on-ground sensors, satellites, and multiple open sources. Ambee's pollen data enables anyone, anywhere in the world, to understand their hyperlocal environment in real time. The datasets provided by Ambee are used to power decisions across continents, from startups to Fortune 500 companies. Using the pollen count data, companies can create valuable campaigns and solutions that help their customers not only avoid seasonal allergies but tackle them all together.
 

Turn Pollen Count Data Into Actionable Insights

Improve Healthcare

Handle chronic health conditions efficiently by understanding environmental triggers.

Personalize Marketing

Access pollen count by zip code and allergy data for personalized marketing and ad campaigns.

Evaluate Risks

Assess future risks to health caused by seasonal pollen exposures.

Enhance Customer Experience

Increase consumer engagement with real-time pollen updates, personalized alerts.

Optimize Products

Optimize workflows, manage anti-allergy product needs, forecast sales better based on real-time, historical data and forecast pollen data

Increase Research Efforts

Support health research effort with accutrate allergy forecast data

Global Businesses Making An Impact With Our Pollen Data

Kimberly Clark

Kimberly-Clark Corporation

KCC uses Ambee’s pollen data to strengthen their marketing efforts for anti-pollen allergic tissues for the brand Kleenex. They have also created their pollen tracking platform Pollen Pal using our data.

Boots

Boots

Boots uses Ambee’s hyperlocal pollen data to create personalized marketing campaigns and boost targeted sales efforts. 

Adylic

Adylic

Adylic helps brands trigger dynamic ads based on Ambee’s pollen data.

Testimonials

What people are saying about us

We must understand the environmental changes and act upon them in the right way. Ambee keeps us in tune with our environment and is key to creating better outcomes for people.

Vipul Parmar
Global Head of Data Management, WPP

We monitor the impacts of AQ on the health outcomes of asthma and COPD patients. Ambee gives great access to hyperlocal data to help us monitor acute respiratory health events.

Luke Marshall
CEO, and Founder, VitalFlo

Solving climate change requires collaboration across industries. Hence, Razor partnered with Ambee to make reliable real-time and accurate data available to the blockchain.

Hrishikesh Huilgolkar
CEO, Razor Oracle Network

We tried out Ambee’s Weather and Pollen API for our healthcare app. The data was accurate and valuable, and the team was really supportive. I would recommend working with them.

Kunal Kishore Dhawan
Co-founder, and CEO, Navia Life Care

The PACE team is thrilled to be working with partners like Ambee, who bring a fresh perspective to our work and ensure that the PACE mission will provide societal benefit.

Lorraine Remer
Atmospheric Scientist, University of Maryland Baltimore County

The display systems, sensor devices, & data on cloud services truly show why they are the pioneers in the market. The process, too, was easy—incredible work by team Ambee.

V Chandeeswra G
Sr Manager, Brigade

It has helped Adylic showcase the power of utilizing API in personalizing ads. In this case, we were able to target users' needs at the right time based on the user's location.

Stefanie Wong
DCO Specialist, Adylic

Data Redefined Through Proprietary Technology

Collected IconCollected Icon

Collected

We harness the power of on-ground sensors, remote satellite imagery, and a global proprietary sensor network to get credible data from multiple sources.

Analyzed IconAnalyzed Icon

Analyzed

Our proprietary models measure, process, and analyze data from over a dozen sources, processing many terabytes of data every day for an accurate result.

Delivered IconDelivered Icon

Delivered

Real-time, hyperlocal - 1x1 km grid - environmental data is easy to consume through API calls, or on a customized dashboard.

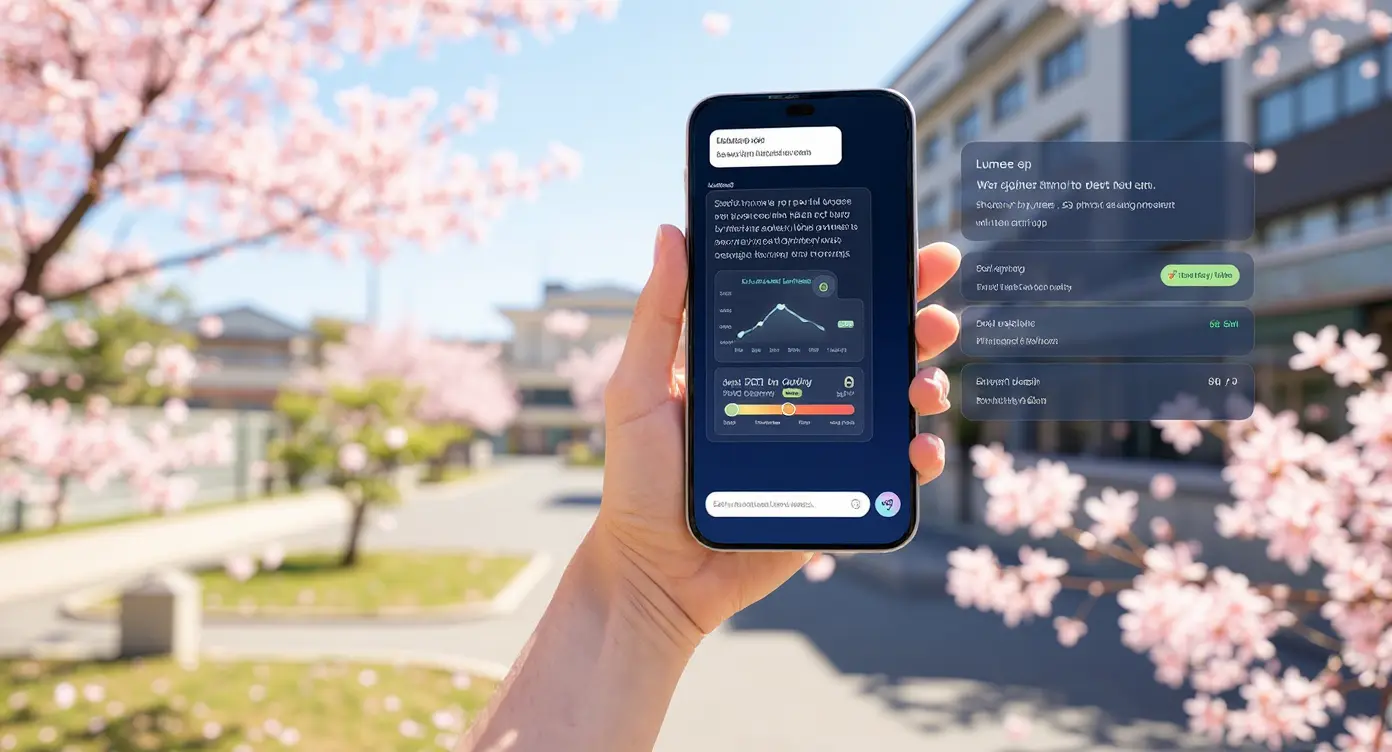
Stay informed about the pollen levels around you and take appropriate measures with the help of Ambee’s pollen app. Download our app now!

Live Pollen Tracking App
FEATUREs of pollen Index API

Accurate Pollen APIs For Every Pollen Species and Coordinates

1K free pollen API records/day post subscription
Zero limitations by country or region
Hyperlocal multi-species pollen counts
Track allergy forecast and seasonality for countries across the world
Pollen Response Parameters
Ambee mockup

Case Study

historical pollen count by zip countPollen Past History Data

Insights from the Past to Protect the Future

Ambee’s extensive historical pollen data sets can help you gain crucial insights on environmental triggers from the past, to plan ahead for the future.

Frequently Asked Questions

What are pollen counts?

Pollen counts are the number of pollen grains present in the air for a standard volume. Pollen counts of 50 or less are considered low, while 500 or more is high.

How are pollen counts measured?

Traditionally, pollen count have been calculated using an air-sampling device such as Burkard Sampler or the Rotorod Sampler. However, this method is considered outdated. At Ambee, we examine multiple pollen stations’ historical data and patterns, while taking into account other phenological factors and behaviors. Using the power of proprietary AI and ML models, Ambee’s virtual pollen monitoring station provides reliable, and accurate pollen counts.

How can we check pollen count?

To get access to accurate pollen count, you have two options:
Log into Ambee’s API dashboard and get access to free pollen count data for 30 days. If you're an enterprise looking for more, you can opt for an enterprise plan for this dataset.
You can get instant access to daily pollen count via Ambee’s pollen app in the Play Store and App Store.

What are the different types of pollen?

There are three main types of pollen: tree pollen, grass pollen, and weed pollen, and under them feature a multitude of sub-species of each type.

What is considered a high pollen count?

Values for pollen count depend on the type of pollen. High pollen count for each type is indicated below:

Trees   90 - 1499
Grass   20 - 199
Weed   50 - 499

What time in the year pollen counts are high?

Different type of pollen has their peak at a different time of the year.
Tree pollen occurs mostly in the springtime. It also often overlaps with grass pollen in the spring and summer.
Grass pollen peaks at different times. In Northern U.S, grass pollen appears in the late spring or early summer. In the South, grasses may release pollen and trigger symptoms throughout the year.
Weed pollen appears in the late summer and fall.

What are the different kinds of pollen allergies?

Pollen allergies can be categorized into tree pollen allergy, weed pollen allergy, and grass pollen allergy.