Resources /
Blogs
How accurate are weather predictions?
May 28, 2026
DVS Roopesh
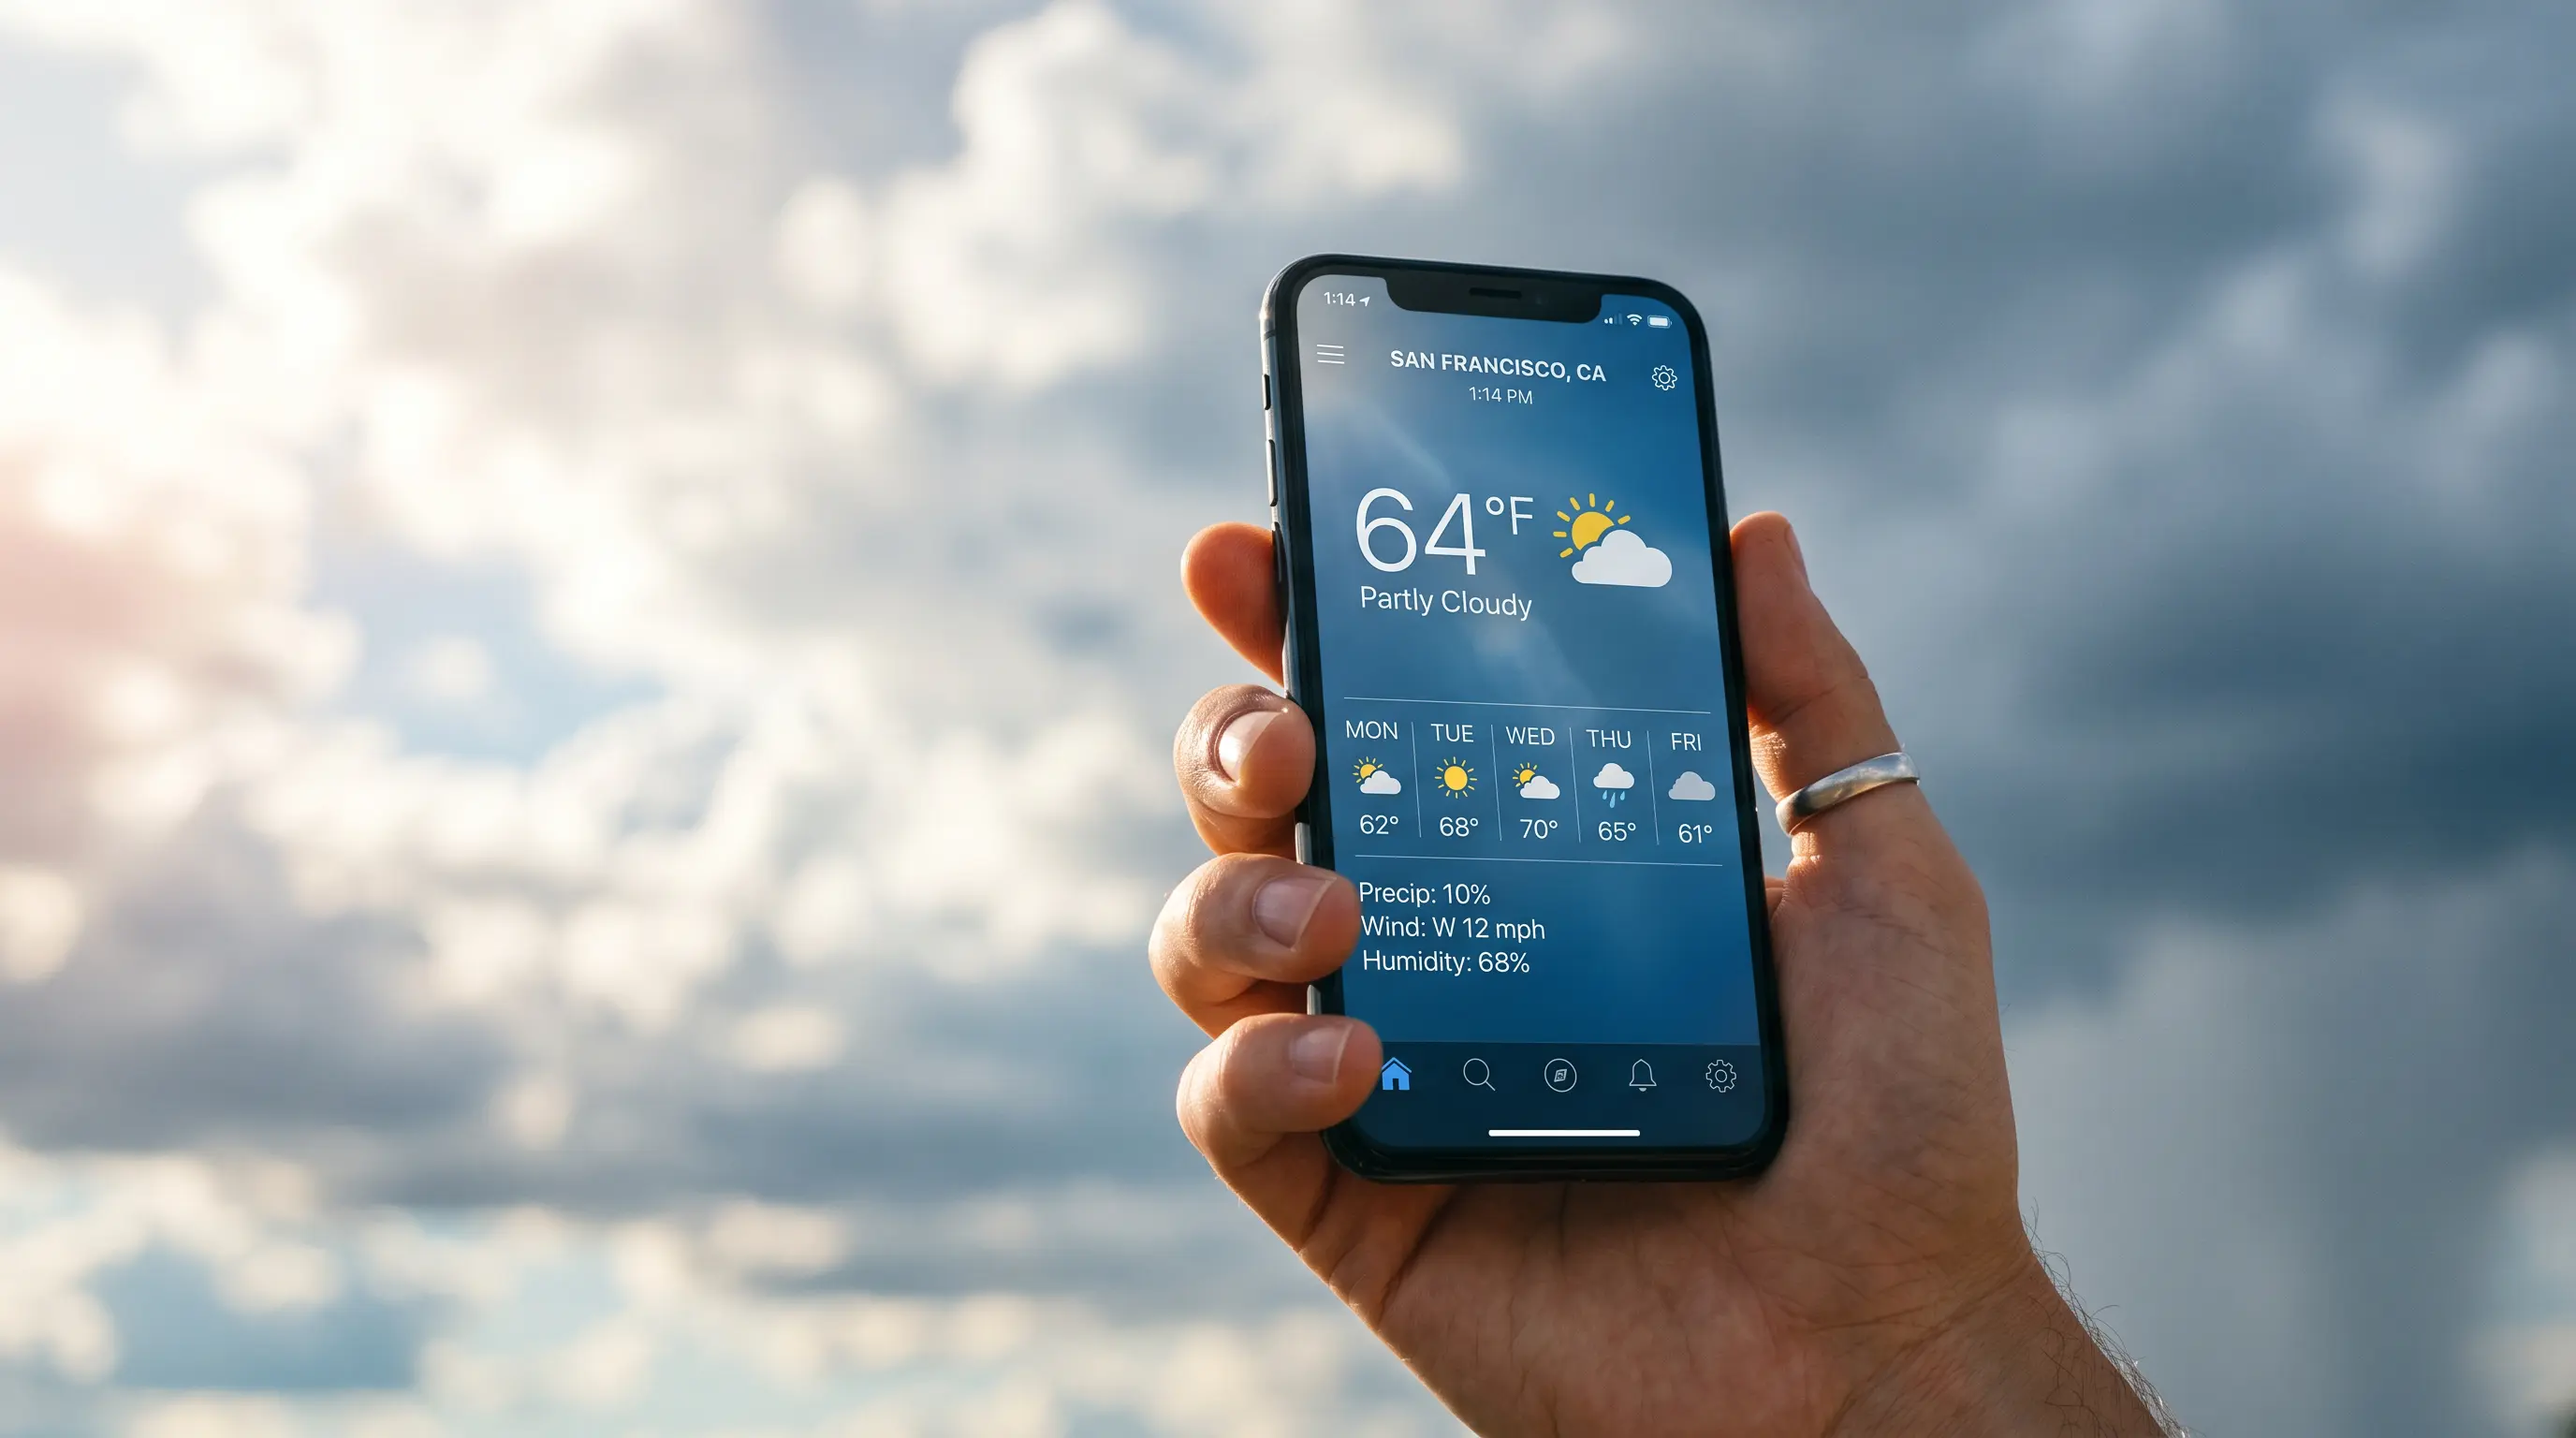
Modern weather forecasts are highly reliable for short-term planning. A 5-day forecast is about 90% accurate, a 7-day forecast hits the mark roughly 80% of the time, and accuracy drops to around 50% once you cross 10 days. Today's 5-day forecast is as accurate as a 1-day forecast was in the early 1990s, and AI models released since 2023 are starting to push the useful forecast horizon past two weeks.
{{key-insights}}
We have all been there. You check the weather app, see zero chance of rain, leave your umbrella at home, and walk into a downpour an hour later. In moments like that, it is fair to ask how accurate weather predictions really are.
The honest answer is more interesting than a single number. Forecast accuracy depends on how far out you are looking, what kind of weather you are predicting, where you live, and which model the forecast is built on. The field has also changed faster in the last three years than at any point in its history, thanks largely to artificial intelligence systems that now beat the best traditional models on most measures.
This guide breaks down what you can trust today, why predictions sometimes miss, and how to read a forecast so you make better decisions about your week, your event, or your business.
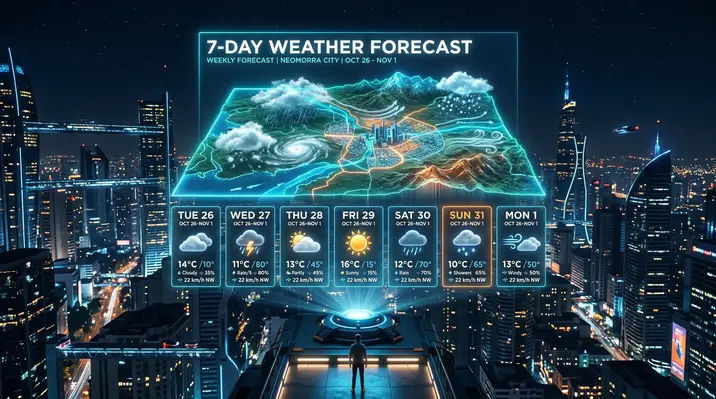
The clearest way to answer this is by time horizon. According to the National Oceanic and Atmospheric Administration (NOAA), a 5-day forecast is accurate roughly 90% of the time, a 7-day forecast about 80%, and a 10-day forecast drops to around 50%.
For context, today's 5-day forecast is about as accurate as the 1-day forecast was in the early 1990s. Better satellites, denser observation networks, faster supercomputers, and now AI have driven that improvement at a rate of roughly one extra day of useful skill per decade.
Here is the breakdown by lead time:
A closer look at each range:
This is the sweet spot. Short-term forecasts of one to three days routinely land within one to two degrees on temperature and a few tenths of an inch on rainfall. If your app says rain tomorrow afternoon, plan accordingly.
Still highly reliable, around 90% accurate. This is the range that event planners, travel decisions, and supply chain teams generally trust for go-or-no-go calls.
Around 80% accurate. General patterns hold up well, like a warming trend or an incoming storm system, but exact timing and rainfall amounts may shift by the time the day arrives.
Accuracy falls to roughly 50%, closer to a coin flip than a confident call. The European model recently pushed useful skill past ten days for the first time with a major upgrade in late 2024, but daily-level precision at that range is still limited.
For decades, meteorologists treated 14 days as a hard ceiling because errors in numerical models roughly double every five days, and the chaotic behavior of the atmosphere caps useful forecasts at about that range even with perfect data and a flawless model.
Recent AI research is starting to push on that limit. A 2025 study using Google's GraphCast model showed reasonable accuracy out to 33 days when researchers optimized the initial conditions fed in. That is research, not operational forecasting yet. For now, treat anything past two weeks as a general outlook (a warmer-than-average week, a wetter-than-average month) rather than a daily forecast.
When the forecast goes wrong, three forces are usually at work.
This is the famous butterfly effect, named for a 1972 talk by meteorologist Edward Lorenz. He found that tiny changes in initial conditions could lead to vastly different states later, the foundational insight of chaos theory. Small measurement errors at hour zero grow into wide differences by day ten. That is why a one-day forecast feels sharp and a ten-day forecast feels fuzzy.
Forecasts are only as good as the data feeding them. Over oceans, in mountainous terrain, and across parts of the world with sparse sensor coverage, the observation network has real holes. Models fill those gaps with estimates, and those estimates carry forward through every hour of the forecast.
A ten-mile gap between weather stations is plenty of room for a thunderstorm to develop, miss the station, and never show up in the data. Your neighborhood may sit on a slope, near a lake, or inside an urban heat island that behaves differently from the broader area the model is predicting for. This is also why you can see rain on your app while the sky outside looks clear.
Some weather behaves more predictably than others. The four trickiest categories:
If your phone says 72 and partly cloudy and your friend's app says 68 and rain, neither is necessarily wrong. Each weather provider makes different modeling choices. Some use one model, some average several, and some now blend AI behind the scenes. Most consumer apps also interpolate between weather stations rather than reading directly from one, so the sparser the station network near you, the more guesswork goes into your local number.
Models also run on different grid resolutions, ingest different observations, and use different math to solve the equations of the atmosphere. That is why the same hour can look different across two apps even when both are working correctly. Cross-checking two or three sources before a high-stakes outdoor plan is the simplest way to spot disagreement and read it as a signal of uncertainty.
The biggest shift in meteorology in the last decade has happened in the past three years.
Google DeepMind's GraphCast model outperformed the leading traditional system on 90% of 1,380 verification targets and can produce a 10-day global forecast in under a minute on a single desktop computer.
The European Centre for Medium-Range Weather Forecasts (ECMWF) launched its own AI Forecasting System operationally in February 2025, followed by an ensemble version in July 2025. It runs with roughly a thousand times less energy than the equivalent physics-based model while delivering competitive, and in some measures superior, accuracy, with tropical cyclone track forecasts improving by up to 20%.
NOAA also deployed a new suite of AI-driven global weather models in early 2026, with skill comparable to its existing systems while using only about 9% of the computing resources.
For anyone building applications on top of weather data, the deeper shift is this. Forecasts are not just more accurate, they are also faster and cheaper to produce, which makes real-time integration into business workflows far more practical than it was even three years ago.
Not every location is equally predictable. Forecasts tend to be more reliable in regions with stable weather patterns, flat terrain, and dense observation networks. They become harder in:
This is why predicting weather in a city like Denver is genuinely harder than forecasting for a flat coastal town with steady prevailing winds.
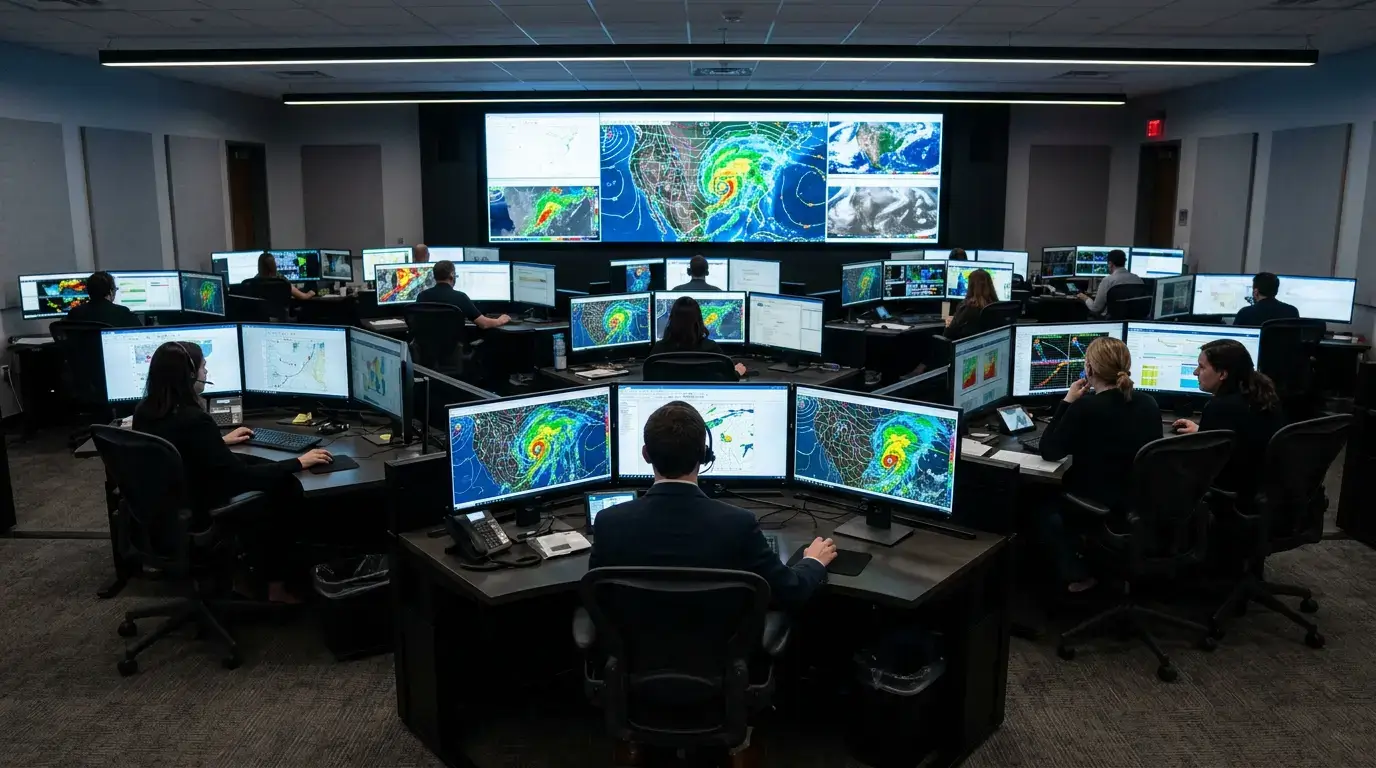
Today's forecasts are a blend of physics, observation, and increasingly, machine learning. Real-time data comes in from weather balloons, commercial aircraft, ocean buoys, ground stations, and a fleet of satellites. All of it feeds into Numerical Weather Prediction (NWP) models, which simulate what the atmosphere will do next.
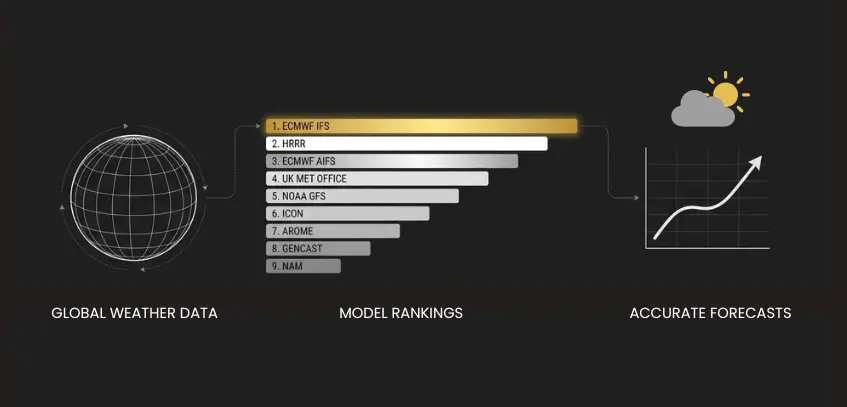
For a deeper walkthrough of the workflow, see our guide on how meteorologists predict the weather. For a comparison of the leading systems behind modern forecasts, including ECMWF, GFS, GraphCast, and AIFS, see our breakdown of the best weather forecast models.
The other half of the accuracy equation is data volume and historical context. Businesses that depend on precise weather planning generally do not rely on a consumer app. They use specialized tools that pull from multiple models and combine real-time conditions with deep historical records. A reliable weather API gives developers and operations teams access to hyper-local, constantly refreshing forecasts. Pairing that with historical weather data lets organizations train their own models, analyze long-term trends, and make sharper operational decisions.
A few habits separate people who take forecasts at face value from people who actually use them well.
A 30% chance of rain does not mean it will not rain, and it does not mean it will rain for 30% of the day. It means that, given current conditions, three out of ten times this setup occurs, measurable rain falls somewhere in the forecast area.
If the seven-day outlook changes significantly every time you check, that is a strong sign of low model confidence. Stable forecasts that hold up across updates are more trustworthy than ones that bounce around.
Forecast accuracy is highest for the things that matter most. Tornado warnings, hurricane track forecasts, and severe thunderstorm advisories are issued specifically because the signal is strong. If your area is under a warning, take it seriously.
For weddings, outdoor events, travel days, or anything weather-sensitive, check two or three sources from different providers. A reliable weather app gives you the short-range forecast on your phone, but pairing it with a second source raises your confidence. Convergence means the models agree. Divergence is the signal telling you it is not sure.
More than you probably do. A short-range forecast of one to three days is something you can plan around with high confidence. A medium-range forecast of five to seven days is good for general direction. Anything past ten days is a hint, not a promise.
The best way to think about a weather forecast is not as a promise. It is as a probability map built from massive amounts of real-time data, historical patterns, atmospheric physics, and increasingly sophisticated models. That little rain cloud icon on your phone is really the visible tip of one of the largest scientific operations on Earth.
And honestly, it is kind of astonishing that it works as well as it does.
00:00
/
00:00
00:00
/
00:00
00:00
/
00:00
00:00
/
00:00