Get the most reliable climate data
Oops! Something went wrong while submitting the form.


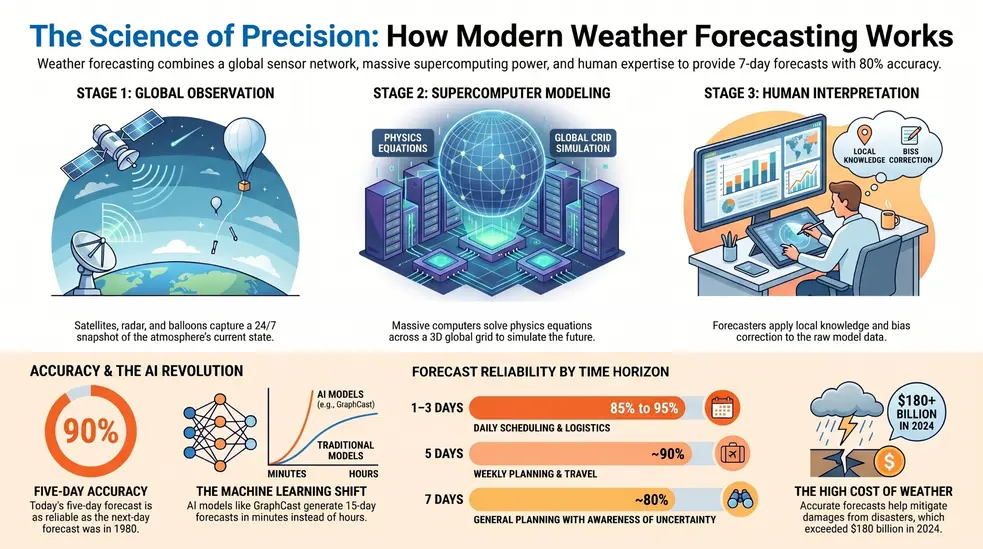
Meteorologists predict the weather in three stages. They observe current atmospheric conditions using satellites, Doppler radar, weather balloons, and tens of thousands of ground stations. They feed that data into supercomputer models that solve physics equations across a three-dimensional grid covering the entire planet. Human forecasters then refine the model output using local knowledge and pattern recognition before issuing the final forecast.
{{key-insights}}
Modern forecast accuracy is higher than most people realize. Five-day forecasts are accurate about 90 percent of the time, seven-day forecasts about 80 percent, and 10-day forecasts about 50 percent. Useful skill drops off beyond two weeks because of the butterfly effect, where tiny errors in initial conditions compound into large errors over time.
The biggest current shift is artificial intelligence. Machine learning models like Google DeepMind's GraphCast and GenCast now outperform traditional physics-based models on most verification metrics, while generating 15-day forecasts in 8 minutes instead of hours. The most accurate forecasts in 2026 combine physics, machine learning, historical data, and human judgment.
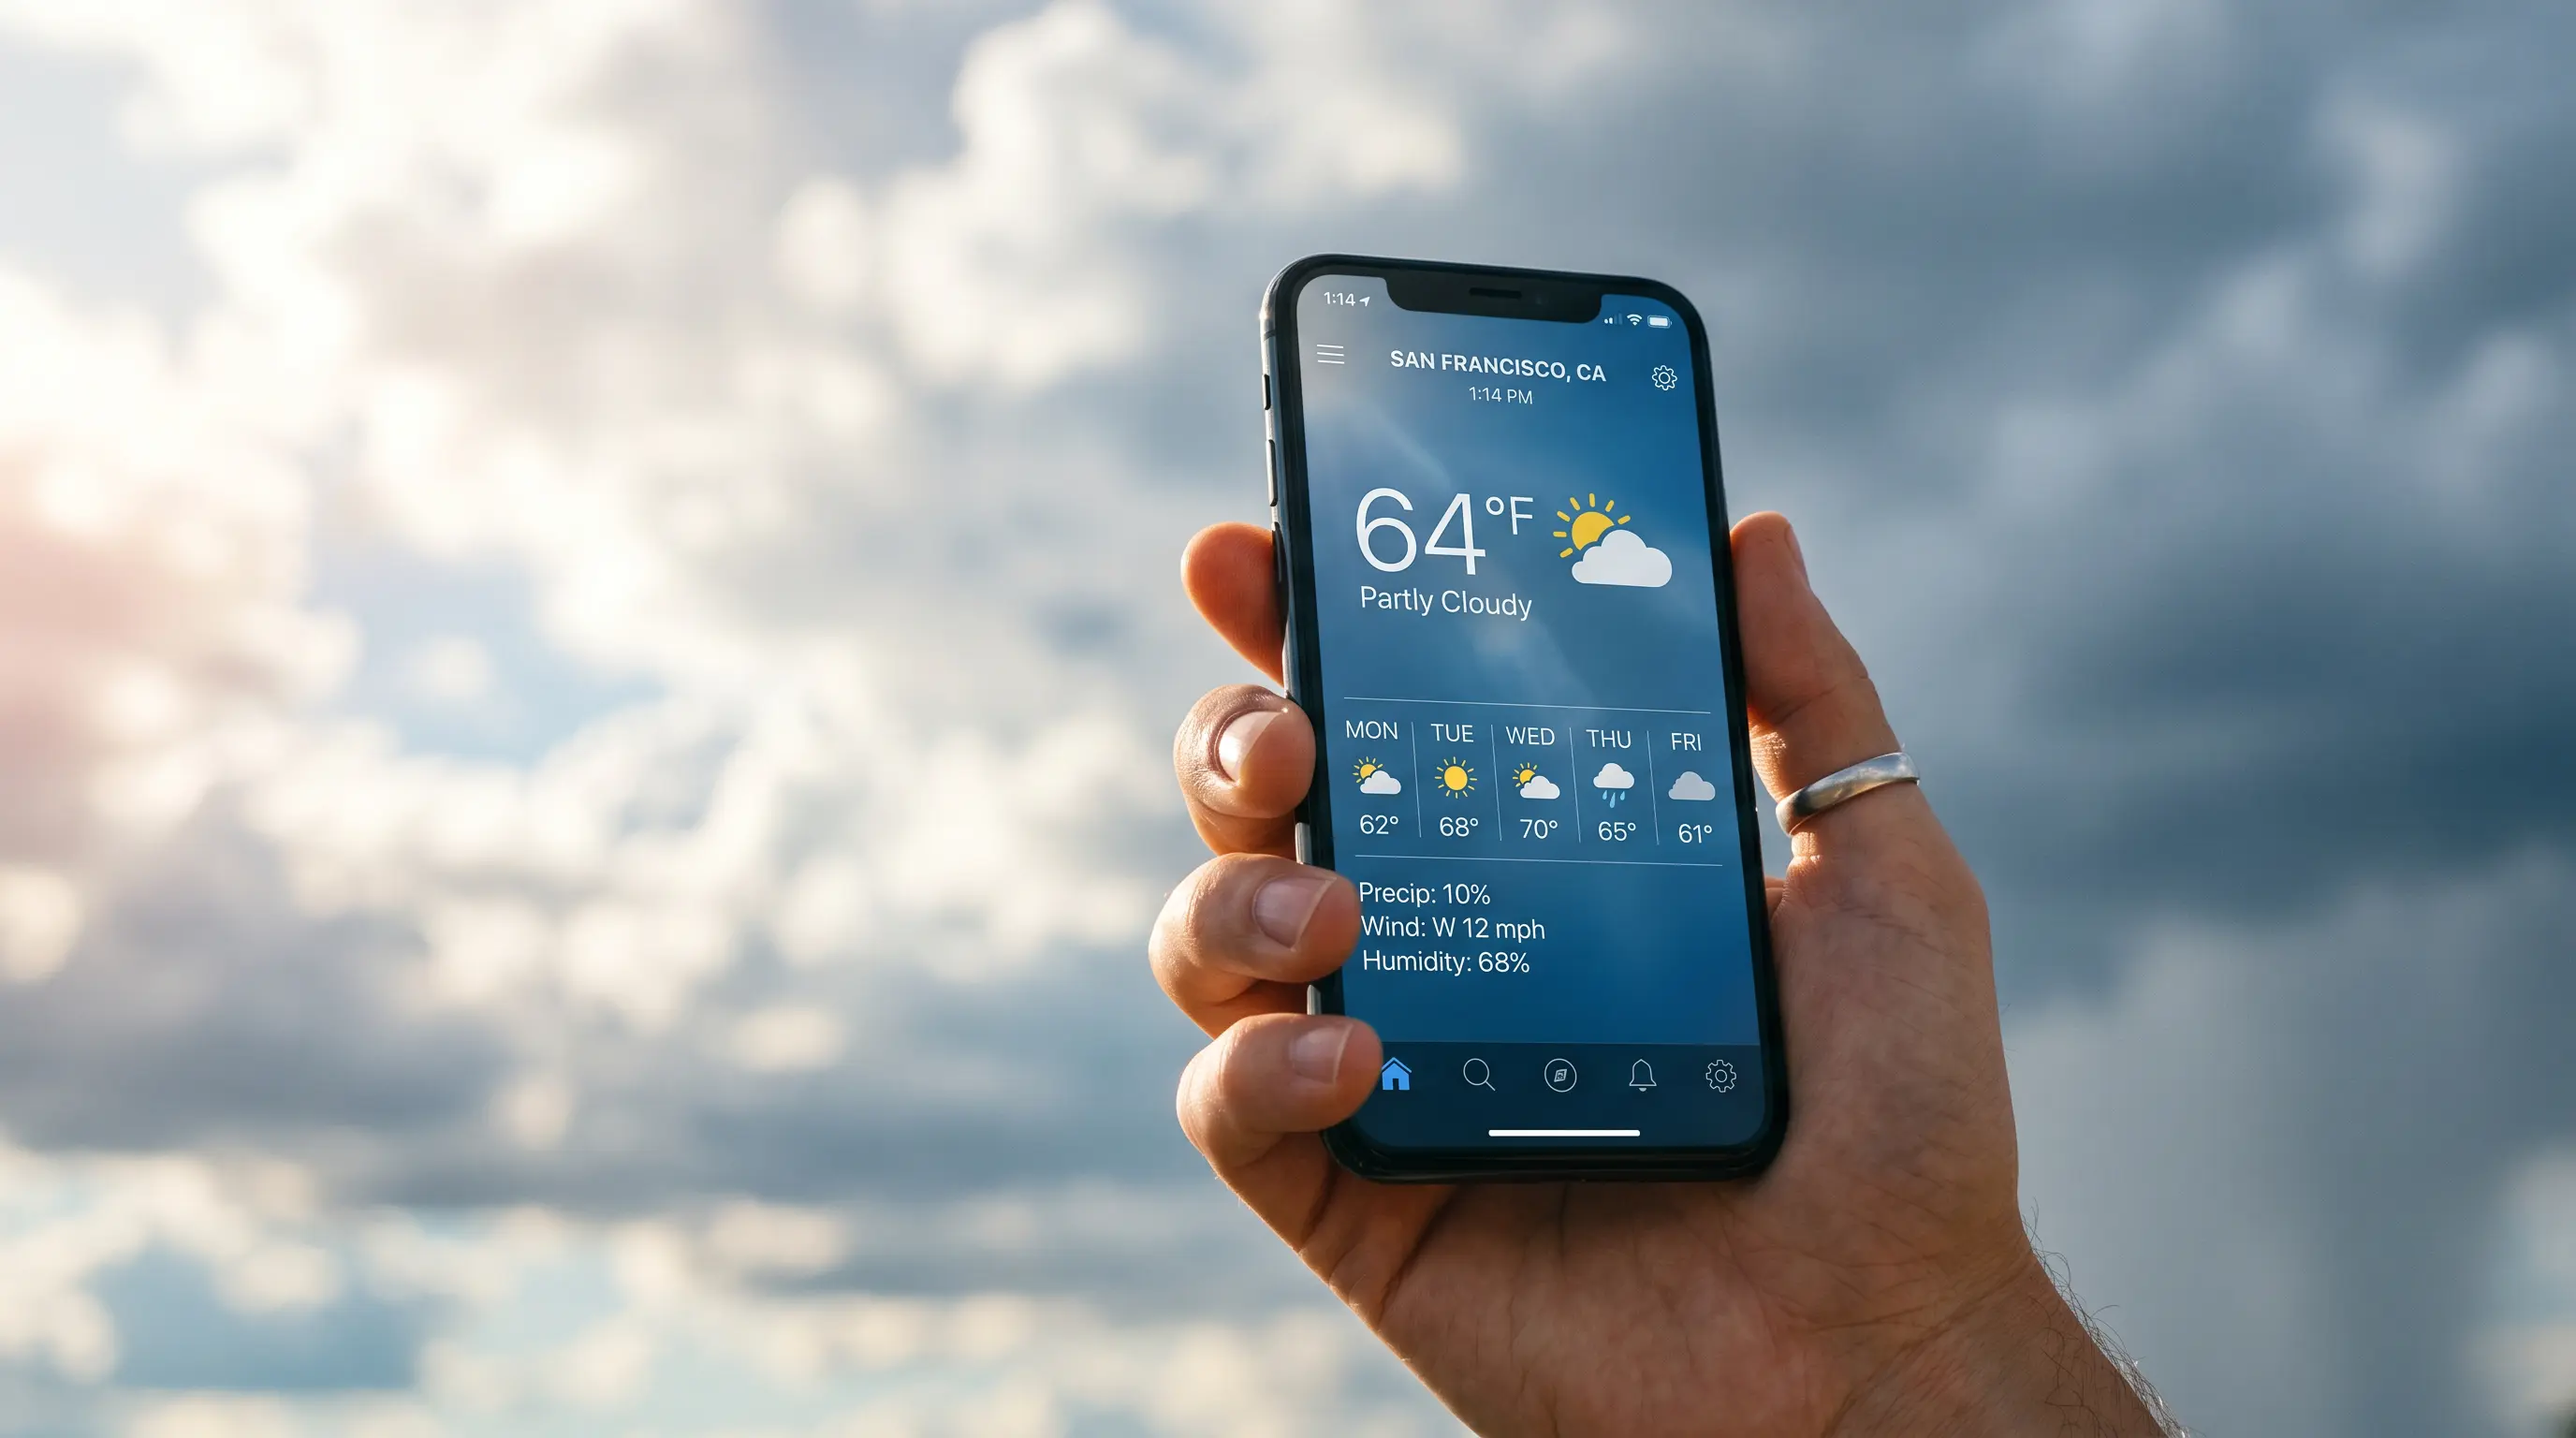
You glance at your phone before leaving the house. Seventy percent chance of rain at 4 p.m. You grab an umbrella. That little number on your screen is the end product of one of the most ambitious scientific operations on the planet, involving satellites orbiting 22,000 miles above Earth, balloons drifting through the stratosphere, ocean buoys, supercomputers running quadrillions of calculations per second, and trained forecasters making judgment calls.
The stakes are high. Forecasts that were once unreliable beyond a single day are now usefully accurate up to seven days out, and the gap keeps narrowing. Between 2021 and 2024, the United States alone faced more than 90 billion-dollar weather and climate disasters, with damages exceeding $180 billion in 2024. Accurate forecasting helps reduce those losses, guides safety decisions for millions of people, and powers everything from supply chains to flight paths.
This guide walks through exactly how meteorologists predict the weather today, how accurate they really are, and why the field is undergoing the biggest shift in 50 years.
Every reliable forecast follows the same three-stage process. Skip a stage, and the prediction falls apart.
Stage 1: Meteorologists must establish what the atmosphere is doing right now. Without a precise current state, no forward simulation can work.
Stage 2: Supercomputers run that data through mathematical models built on the laws of physics, producing projections days or weeks into the future.
Stage 3: Human forecasters interpret the model output, correct for known biases, and apply local knowledge before issuing the official forecast.
Most modern forecasting agencies, from NOAA to the UK Met Office to the Australian Bureau of Meteorology, follow exactly this pipeline. The technology has evolved enormously, but the framework has not. Private weather data providers like Ambee weather data follow the same architecture, ingesting from global models, satellite imagery, and ground sensor networks before delivering processed data to enterprise users.
Before any prediction happens, meteorologists need a complete snapshot of the atmosphere. This is the observation network, and it operates 24 hours a day across the entire planet.
Satellites are the backbone of modern observation. Three categories work in tandem.
Geostationary satellites, including the GOES series operated by NOAA, sit approximately 22,300 miles above Earth's equator. They travel at the same speed as Earth's rotation, which lets them stay parked over the same region. From that altitude, GOES-16 and GOES-19 capture full-hemisphere imagery as often as every 30 seconds, enabling forecasters to watch thunderstorms develop in real time and track hurricane eyewalls.
Polar-orbiting satellites operate much closer to the surface, circling the planet from pole to pole. The Joint Polar Satellite System crosses the equator 14 times each day, scanning a different slice of Earth on every pass. Together, these satellites achieve full high-resolution global coverage twice a day, providing the temperature, humidity, and atmospheric profile data that global weather models depend on.
Deep space and specialized satellites round out the network. The Deep Space Climate Observatory sits one million miles from Earth, monitoring solar flares and space weather. The Jason-3 satellite tracks global sea levels.
Radar handles what satellites struggle to see clearly: precipitation and storm structure close to the ground. The National Weather Service operates a network of approximately 160 NEXRAD radar towers across the United States.
Doppler radar sends out focused bursts of electromagnetic energy. When a pulse hits a raindrop, snowflake, or hailstone, a small fraction reflects back. The radar measures two key things: the strength of the returning signal (reflectivity), which indicates precipitation intensity, and the phase shift of the signal (velocity), which reveals how fast precipitation is moving toward or away from the radar.
That velocity data is critical for tornado detection. When bright outbound velocities appear directly next to bright inbound velocities on a radar display, the signature indicates a rotating column of air. Combined with a specific reflectivity pattern, it gives the National Weather Service enough evidence to issue tornado warnings.
Twice a day at the same time worldwide, meteorological agencies launch about 800 weather balloons globally, with around 90 of them released across the United States alone. Each balloon carries a small instrument called a radiosonde that transmits temperature, humidity, pressure, and wind data continuously as it climbs.
Over roughly two hours, the balloon rises into the upper stratosphere, eventually bursting at extreme altitudes. The vertical slice of atmospheric data it produces is something no satellite can fully match for accuracy, and it remains one of the most valuable inputs into modern forecast models. During severe weather threats, agencies launch balloons more frequently to refresh the picture in real time.
Tens of thousands of automated weather stations report conditions on land. In the United States, Automated Surface Observing Systems comprise more than 900 stations reporting temperature, dew point, wind, pressure, precipitation, visibility, and cloud cover up to 12 times an hour. Thousands of ocean buoys, ships, and offshore platforms do the same job at sea. Commercial aircraft transmit atmospheric readings during flight, adding millions of observations daily from cruising altitude.
All of this, hundreds of millions of measurements per day, flows into national weather centers, where it gets combined through a process called data assimilation into a single coherent snapshot of the atmosphere. Everything that follows starts from that snapshot.
Once the atmospheric snapshot is built, meteorologists feed it into numerical weather prediction models. This is where computer science meets atmospheric physics.
A modern weather model divides the atmosphere into a three-dimensional grid covering the entire planet. Inside each grid cell, the model uses physics equations to calculate how temperature, pressure, wind, and moisture will evolve in the next few minutes based on what is happening in neighboring cells. Then it repeats the calculation. Hundreds of millions of times.
The smaller the grid cells, the more detail the model captures, but the more processing power it consumes. This is why national weather services rely on some of the most powerful supercomputers on Earth. NOAA's Weather and Climate Operational Supercomputing System runs at multiple petaflops, processing quadrillions of calculations per second.
A single model run gives you one possible future. Because tiny errors in the initial conditions amplify over time, no single run can be trusted blindly. Modern meteorologists run the model many times with slightly varied starting conditions and compare the results. This is called ensemble forecasting.
If most of the runs agree, confidence is high. If they diverge, the forecaster knows uncertainty is high and can communicate that to the public. The probability statements you see in weather apps, like a 70 percent chance of rain, often come directly from ensemble output. If 35 of 50 ensemble members produce rain at your location, you get a 70 percent probability.
Two global models dominate the field. The Global Forecast System, run by NOAA in the United States, runs four times a day. The Integrated Forecasting System, run by the European Centre for Medium-Range Weather Forecasts, runs twice a day and is widely considered the most accurate global model. ECMWF's IFS maintains roughly one day of forecast skill advantage over competitors, and its Cycle 49r1 update in November 2024 pushed useful forecast skill past 10 days for the first time.
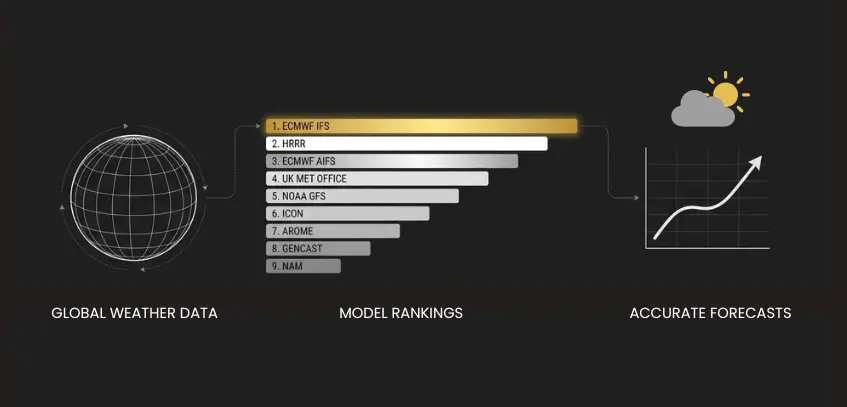
Beyond these, regional and high-resolution models fill in the local detail. The High Resolution Rapid Refresh model leads for short-range forecasts in the United States, while AROME does the same in Western Europe. Forecasters routinely compare multiple models, looking for agreement and flagging divergence. The most reliable weather forecast models in 2026 do not rely on a single model at all. Instead, they fuse outputs from ECMWF, GFS, HRRR, ICON, GEM, GEFS, and others, weighting each based on which has historically performed best for a specific location and parameter.
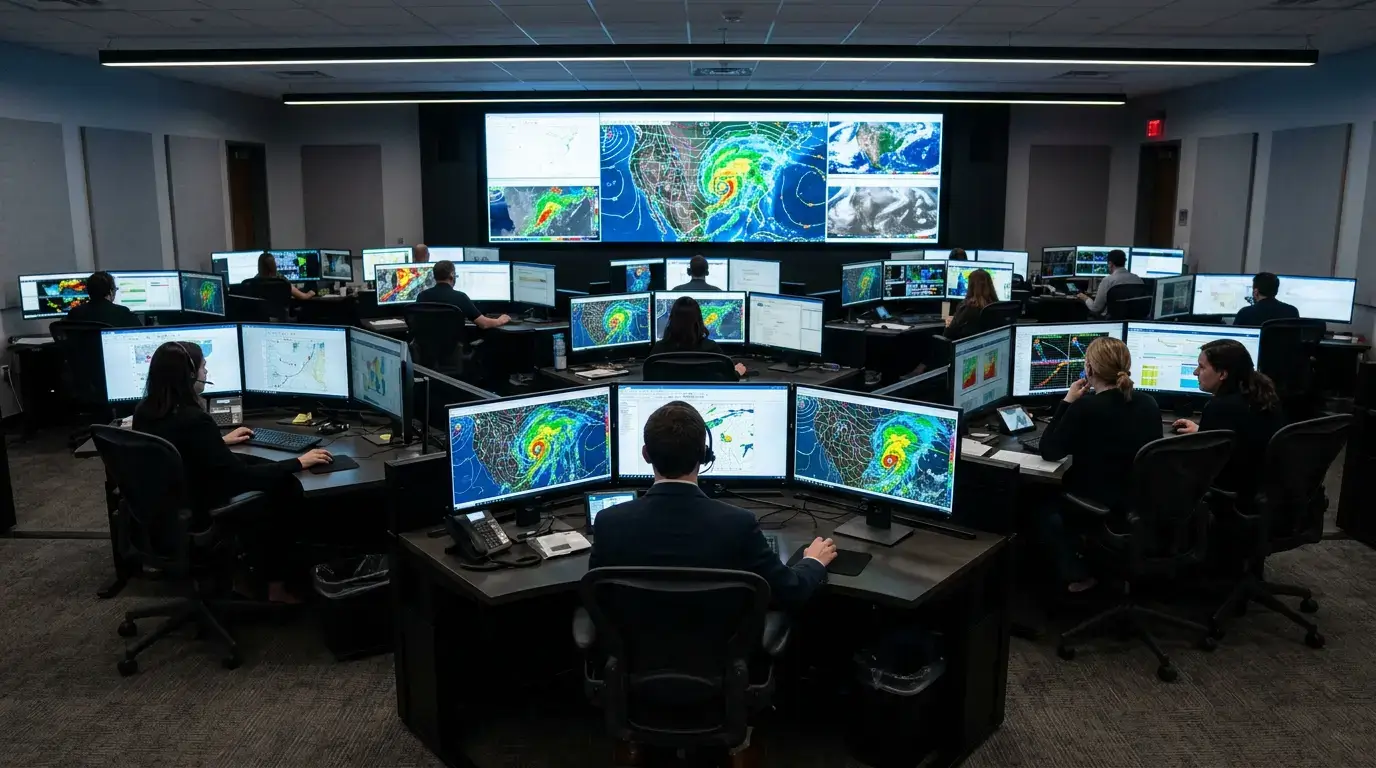
Despite all the automation, human meteorologists remain essential. Computer models have known biases, blind spots, and limitations. A model might underestimate fog in valleys, overpredict snowfall along coastlines, or misjudge thunderstorm timing by hours. Experienced forecasters know these tendencies and adjust.
Most professional meteorologists work through what is called the Forecast Funnel. They start by examining the largest-scale atmospheric features, like the jet stream and major pressure systems, then zoom into regional patterns, and finally into local terrain and microclimate effects. Along the way, they apply local knowledge that models cannot easily capture. Forecasters in Perth know the timing of the Fremantle Doctor sea breeze. New York forecasters understand how cold air pools along the Hudson Valley on calm winter nights. These patterns rarely appear cleanly in global model output but show up reliably year after year. During major weather events, teams debate interpretations and arrive at a consensus before issuing official warnings.
Temperature forecasting builds on the model pipeline but emphasizes specific physical mechanisms.
The first is thermal advection, which is the horizontal transport of air across the surface. When the model shows strong winds blowing from a cold region into a warmer area, forecasters calculate how quickly local temperatures will drop.
The second is radiation. Clouds act as an atmospheric blanket. During the day, heavy cloud cover blocks incoming solar radiation, suppressing afternoon highs. At night, clouds trap longwave radiation rising from the surface, keeping overnight lows warmer than they would be under clear skies. A forecast that misjudges cloud cover almost always misjudges temperature too.
The third is geography. A clear, calm night in a valley can drop 15 to 20 degrees colder than the surrounding hills because cold air sinks and pools. A coastal city can stay 10 degrees cooler than inland suburbs because of sea breezes. Forecasters apply statistical corrections, called Model Output Statistics, based on how a specific location has historically deviated from raw model forecasts. Years of historical weather data feed these corrections, which is why localized forecasts consistently outperform generic model outputs.
Wind, in physics terms, is air in motion driven by pressure differences and shaped by the Earth's rotation. Forecasters predict wind by tracking how pressure patterns will evolve.
Air flows naturally from high-pressure to low-pressure regions. On a weather map, isobars (lines connecting points of equal pressure) reveal both wind direction and intensity. When isobars are packed tightly together, strong winds are guaranteed. When they are spread far apart, the winds will be light.
Air does not travel in straight lines, though. The Coriolis force, generated by Earth's rotation, deflects moving air to the right in the Northern Hemisphere and to the left in the Southern. The result is that air spirals around pressure systems rather than flowing directly into them.
For surface wind forecasts, friction adds another layer of complexity. Buildings, trees, and rough terrain slow the wind near the ground while leaving it unaffected at higher altitudes. Recent model improvements at ECMWF have specifically reduced errors in 10-meter wind speed forecasts, with the number of large errors in extratropical regions dropping 5 to 10 percent over the last year. Forecasters also pay close attention to vertical wind shear, which is the change in wind speed and direction with altitude. Strong wind shear is a critical ingredient for severe thunderstorms, supercells, and tornadoes.
Precipitation is the most difficult variable to forecast accurately. It depends on subtle interactions between moisture, lift, and temperature happening at multiple altitudes simultaneously. A storm that develops 50 miles north of where the model expected it can mean the difference between a flooded street and a sunny afternoon.
For short-range precipitation forecasts, radar is the primary tool. Within the next six hours, a technique called nowcasting tracks existing precipitation systems and extrapolates their movement. Beyond that horizon, models take over. Forecasters look for specific atmospheric setups that produce specific weather. Thunderstorms require warm, moist air rising into colder air aloft. Heavy snow requires the right combination of moisture, lift, and freezing temperatures. Severe weather requires strong wind shear and atmospheric instability together.
Forecast accuracy has improved dramatically over the last 40 years. Most people underestimate by how much.
According to NOAA's National Environmental Satellite, Data, and Information Service, a seven-day forecast accurately predicts the weather about 80 percent of the time, a five-day forecast is right approximately 90 percent of the time, and a 10-day forecast is right about half the time. Both ECMWF and GFS achieve general accuracy of 95 to 96 percent for forecasts up to 12 hours out, 85 to 95 percent for three-day forecasts, and 65 to 80 percent for 10-day forecasts.
Today's three-day forecasts are around 97 percent accurate. By the early 2000s, five-day forecasts had become highly accurate, and seven-day forecasts are reaching that threshold now. Put another way, today's five-day forecast is as reliable as the next-day forecast was in 1980.
Accuracy in this context is typically measured using two statistical metrics. Mean Absolute Error (MAE) captures the average prediction error across many forecasts. Root Mean Square Error (RMSE) does the same but penalizes large deviations more heavily, which is useful for catching forecasts that get small things right but big things very wrong. Reputable weather data providers continuously validate their outputs against ground truth observations using these metrics, and the best ones publish accuracy dashboards so customers can verify the numbers themselves.
Public sentiment about forecast accuracy tends to be harsher than the data warrants. The reason is psychological. People vividly remember the time a sunny forecast turned into a thunderstorm that wrecked their picnic. They forget the dozens of consecutive days when the forecast was exactly right, and their plans went smoothly. Across millions of forecasts measured objectively, meteorology has never been more accurate than it is right now.
Even with billions of observations and supercomputers running constantly, forecasts can bust. Three reasons explain most failures.
The first is chaos. The atmosphere is a chaotic system, which means tiny errors in the starting conditions compound over time. Edward Lorenz first identified this in 1961 and called it the butterfly effect, the idea that the flap of a butterfly's wings in Brazil could theoretically alter weather in Texas weeks later. Because no observation network can capture the atmosphere with infinite precision, some error is baked into every forecast from the start.
The second is resolution. Even the most advanced global models work on grids of 9 to 28 kilometers. Anything smaller, like an individual thunderstorm cell, a sea breeze front, or fog in a single valley, has to be approximated rather than directly simulated. High-resolution providers can now deliver weather data down to sub-kilometer scales by combining global models with local downscaling techniques, narrowing the gap between model output and what the weather actually does in a specific neighborhood.
The third is rare events. Extreme weather sits in the statistical tails of distributions where models have less training data. A 100-year flood, by definition, has not happened often enough for any model to have learned it well.
The biggest shift in weather prediction in half a century is happening right now, and most people have not noticed it yet. Machine learning models trained on decades of historical weather data are starting to outperform traditional physics-based models on many metrics.
Google DeepMind released GraphCast in late 2023. The model predicts global weather up to 10 days ahead. A peer-reviewed study published in Science reported that GraphCast outperformed ECMWF's high-resolution deterministic model on about 90 percent of 1,380 verification targets. GraphCast runs at 0.25 degree resolution, roughly 28 km by 28 km at the equator, covering more than a million grid points across Earth's surface.
Its successor, GenCast, took another leap. Published in Nature in December 2024, GenCast was more accurate than ECMWF's operational ENS ensemble on 97.2 percent of verification targets and on 99.8 percent at lead times beyond 36 hours. GenCast generates a 15-day forecast in approximately 8 minutes, compared to traditional methods that may take hours on supercomputers running tens of thousands of processors. ECMWF has released its own Artificial Intelligence Forecasting System, AIFS, which now ranks above or close to other machine learning models for both upper-air and surface forecasts.
These AI models do not replace traditional physics-based models. They sit alongside them as another voice in the forecast discussion. When AI and traditional models agree, confidence rises. When they diverge, that disagreement itself is useful information. The most accurate forecasts in 2026 increasingly combine physics, statistics, machine learning, and human interpretation into a single integrated product. This is also why forecast horizons have stretched: subseasonal predictions out to 46 days are now possible because AI models can extract useful signals from historical patterns that physics-only models struggled to leverage.
By the time a forecast arrives in your weather app, your car's navigation system, or a logistics company's routing software, it has moved through several layers. Raw model output from NOAA, ECMWF, and other meteorological agencies gets ingested by forecast providers who apply post-processing, location-specific corrections, and quality control. From there, it is distributed through weather APIs, which is how the vast majority of modern applications fetch real-time forecasts and observation data.
For more advanced use cases, like training a crop yield model, calibrating an insurance risk score, predicting energy demand, or validating an AI weather model, historical weather data becomes essential. Forecasters and data scientists use decades of past observations to test how new models would have performed, identify systematic biases in current forecasts, and build better predictions for the future. Hourly historical data going back 30 or more years is the foundation that modern machine learning forecasts are built on.
The takeaway is that weather data is no longer a service only national agencies consume. It sits underneath thousands of products and decisions made every day, from when an outdoor concert can safely go ahead, to how an airline routes around turbulence, to whether a retailer ships extra umbrellas to a specific zip code.
How do meteorologists predict the weather? They observe the atmosphere continuously with satellites, radar, balloons, and surface stations. They feed those observations into supercomputer models that simulate how the atmosphere will evolve using the laws of physics. They run those models many times to gauge uncertainty. They apply human judgment to correct for known model weaknesses. And increasingly, they blend traditional physics-based forecasts with machine learning systems that learn directly from decades of historical weather data.
The result is the most accurate forecasting in human history. Still imperfect, but improving every year. The next time your weather app gets it right five days out, remember the chain of science, engineering, and human judgment running quietly in the background to make it happen.