Get the most reliable climate data
Oops! Something went wrong while submitting the form.


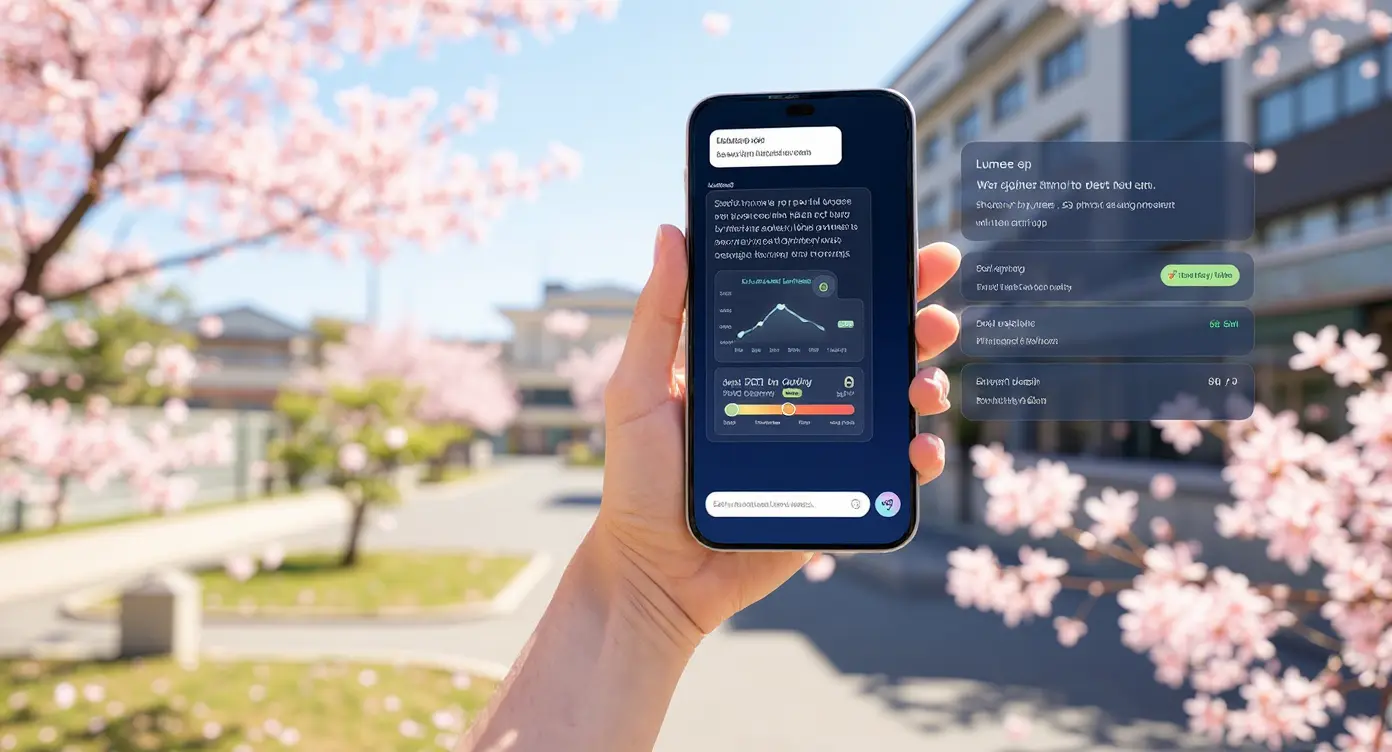
Sure, you might be shopping your wishlist during the Christmas break, but consumer demand is increasingly shaped by invisible health and environmental signals. Through a forensic analysis linking air quality shifts to air purifier pricing, search interest, and sales behavior, this article shows how pollution, pollen, and climate volatility quietly drive what people buy across wellness, retail, and pharma categories. Ambee captures these signals in real time and turns them into actionable forecasts. See how ClimaChain helps you plan inventory with deeper foresight
{{key-insights}}
At the start of the COVID-19 lockdown, toilet paper became one of the most notable items to disappear from shelves. While it’s easy to blame panic buying, the real story is more complex.
Before the pandemic, 35% of toilet paper demand came from commercial use. But when COVID hit, demand for home toilet paper skyrocketed, while commercial demand plummeted.
The root cause is this: Retailers restock based on backroom inventory, not real-time sales, creating a 20-30 day delay in response to demand spikes. Manufacturers, relying on outdated data (often 4–6 weeks old), struggled to keep up.
As shelves stayed empty, panic buying intensified, making the situation worse.
At the heart of this issue, and perhaps unrealized by many, was a lack of foresight.
Had inventory planners been looking beyond sales data, toward early health signals like rising flu activity, regional movement restrictions, or localized outbreak alerts, they could have anticipated the shift in consumer behavior weeks earlier.
Now consider what that blind spot really costs, in missed revenue, at a moment when spending on health and wellness products was rising faster than almost any other category.
McKinsey’s recent survey of more than 9,000 consumers across China, Germany, the United Kingdom, and the United States reveals that nearly 30% of Gen Z and Millennials in the U.S. are prioritizing wellness more than they did a year ago.
This growing focus on wellness is translating into spending, with Gen Z and Millennials driving 41% of annual wellness spend, despite making up only 36% of the adult population.
If health and wellness are permeating everyday life to this extent, what does that mean for demand planners who are expected to accurately forecast what people will buy, and when they will buy it?
Especially when it comes to categories that were once considered non-medical, like air purifiers, humidifiers, and even food and personal care items.
To understand how seasonal health trends influence shopping behavior, we performed an exercise.
We tracked the price changes of Amazon’s top-selling air purifier over the past year and compared them with Ambee’s AQI data. This allowed us to see a clear connection between environmental factors like poor air quality and consumer demand, showing through increased searches and purchases of air purifiers.
The goal was to determine if rising pollution or bad air quality leads to a spike in product interest and sales.
Before we dig into this, quick note: we've run similar analyses with pharmaceutical companies on their product portfolios. The correlations between pollen spikes, air quality shifts, humidity drops, and product demand? They show up every time. We've observed the patterns hold across respiratory meds, skincare, and OTC products. So when we track an air purifier against AQI data, we already know what we're looking for.
The product we tracked was the LEVOIT Air Purifiers for Bedroom Home Dorm, 3-in-1 Filter Cleaner with a fragrance sponge, designed for better sleep. It filters smoke, allergies, pet dander, odors, dust, and is ideal for office or desktop use. This air purifier ranks as one of Amazon’s best sellers in the category.
To gain deeper insights into how consumer interest in air purifiers fluctuates, we tracked Google search trends for “air purifier” and the LEVOIT Air Purifiers brand over the course of a year.
Using Google Trends, we observed how the popularity of these searches varied across different locations in the U.S.
We found that North Dakota had the highest search volume for the term "air purifier," followed by Maine. Additionally, the LEVOIT Air Purifiers were highly searched in Maine.

For this study, we will focus on the AQI data for these two locations (North Dakota and Maine) to understand the relationship between air quality and consumer interest.
After analyzing the search‑volume data, we tracked the price fluctuations (Amazon) for the LEVOIT Air Purifier.
Here's what we found:
Once we layered Maine and North Dakota’s AQI timelines, sourced from Ambee’s Air Quality data, over Keepa’s price history for the LEVOIT Air purifier, an interesting pattern emerged.
The purifier did not become more expensive at random. It became more expensive when breathing became harder.
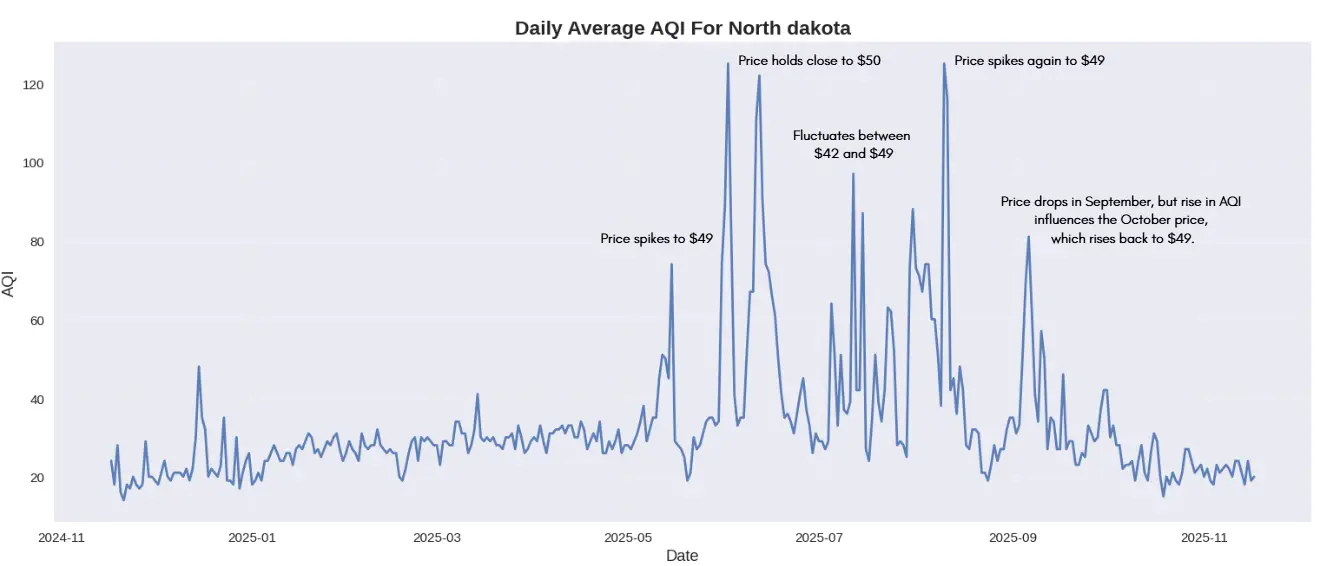
What happened in North Dakota:
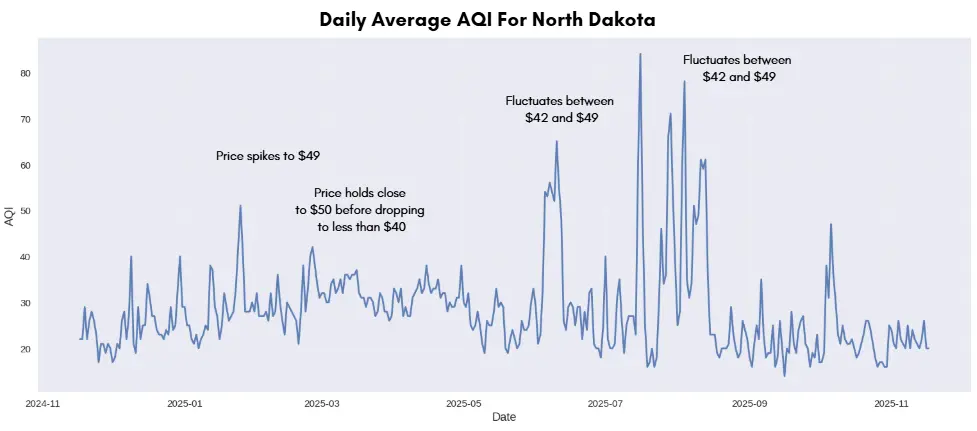
What happened in Maine:
The pattern:
You'll also notice brief price drops even during elevated AQI periods. This, as you’re aware, is a common retail practice: when demand surges, sellers sometimes lower prices slightly to push even more volume while interest is high.
These climate-driven price cycles show up far beyond air purifiers. They sit on top of a much larger shift: wellness has become a demand amplifier across categories.
People now monitor their environment the way they once monitored steps or calories, and their willingness to spend on “better” rises with that awareness.
Which brings us to what consumers say they value today:
What was once the domain of gym bags and training blogs is now tracked, quantified, and optimized in real time. Protein coffee. Sleep scores. Air quality alerts. Wellness is a feedback loop.
And businesses are listening.
NielsenIQ’s 2025 Global Health and Wellness Survey found that 1 in 5 consumers say their health purchases are significantly influenced by influencers or social media content (case in point: the "girl dinner" trend hit 60 million views and actually shifted supermarket deli layouts). Meanwhile, 117 countries now tax sugary drinks, and the results are measurable.

A McKinsey wellness outlook noted that wellness has become:
“A daily, personalized practice rather than an occasional activity.”
Sleep disruption affects nearly 1 in 3 adults, so white noise machines, weighted blankets, and smart mattresses became everyday essentials. Air quality concerns drove demand for sensors, purifiers, and humidifiers.
Health and wellness apps hit 3.6 billion downloads in 2024. Wearable sales grew 4% globally. People are tracking sleep, stress, heart rate, and respiration in real time.
Here's a case study that reflects how tracking this data allows companies to anticipate what consumers will need before they search for it.
In 2024, a global pharmaceutical company manufacturing nasal allergy products faced a puzzling problem. Allergy cases were rising across the U.S., but their sales dropped 16% year over year in the first half of the year.
Here are all the facts we know:
At this point, the company integrated Ambee's ClimaChain into its existing demand planning system.
ClimaChain added a hyperlocal forecasting layer powered by pollen, weather, and air quality data, producing a 30-day rolling forecast that updated weekly for every store and SKU.
Soon, things started to look up:
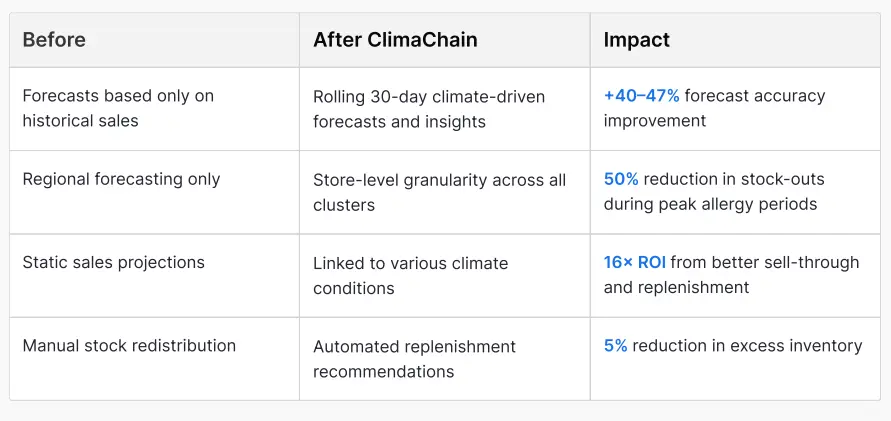
This integration was seamless because the process remained familiar to planners, but planning decisions were now based on measurable climate signals instead of relying on seasonal averages.
Even though it is obvious why someone buys a humidifier during allergy season, the same logic does not immediately apply to honey or electric kettles. But these items actually move in sync with seasonal health patterns, even when shoppers themselves do not consciously frame them as “health purchases.”
Below is a table of products that look random on the surface but correlate strongly with respiratory shifts, humidity drops, pollen surges, and pollution peaks.
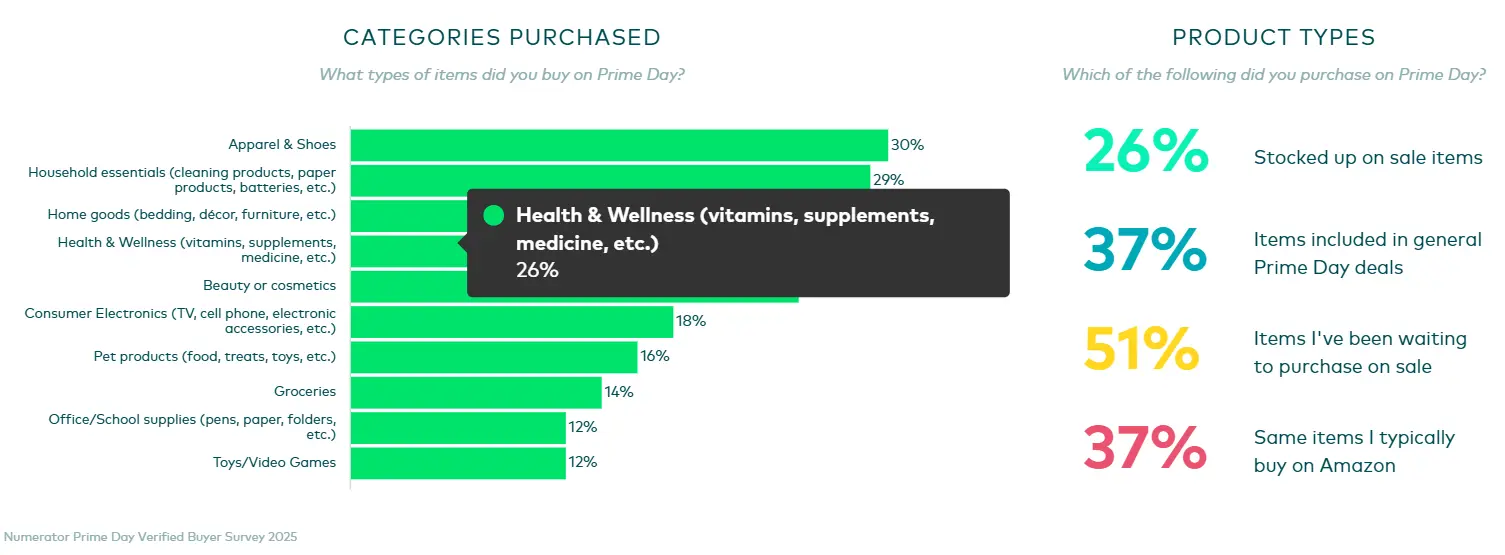
If you are betting your money on shopping patterns, studying Prime Day and Black Friday tells you exactly when the national appetite reaches its peak. These events are concentrated behavioral flashpoints.
In 2025, Amazon recorded more than 154,000 Prime Day orders, 307,000 items purchased, and over 52,000 households participating. The average shopper placed more than two separate orders and spent approximately $156 over the event window.
What people buy during these events says even more. The top sellers on Prime Day were Premier Protein Shakes, Dawn Powerwash, and Liquid I.V. hydration packets. Two out of every three Prime Day items sold for under $20.
This tells us that high-intent shoppers are increasingly gravitating towards products that solve immediate physical discomforts such as fatigue, dehydration, immunity worries, and home environment control.
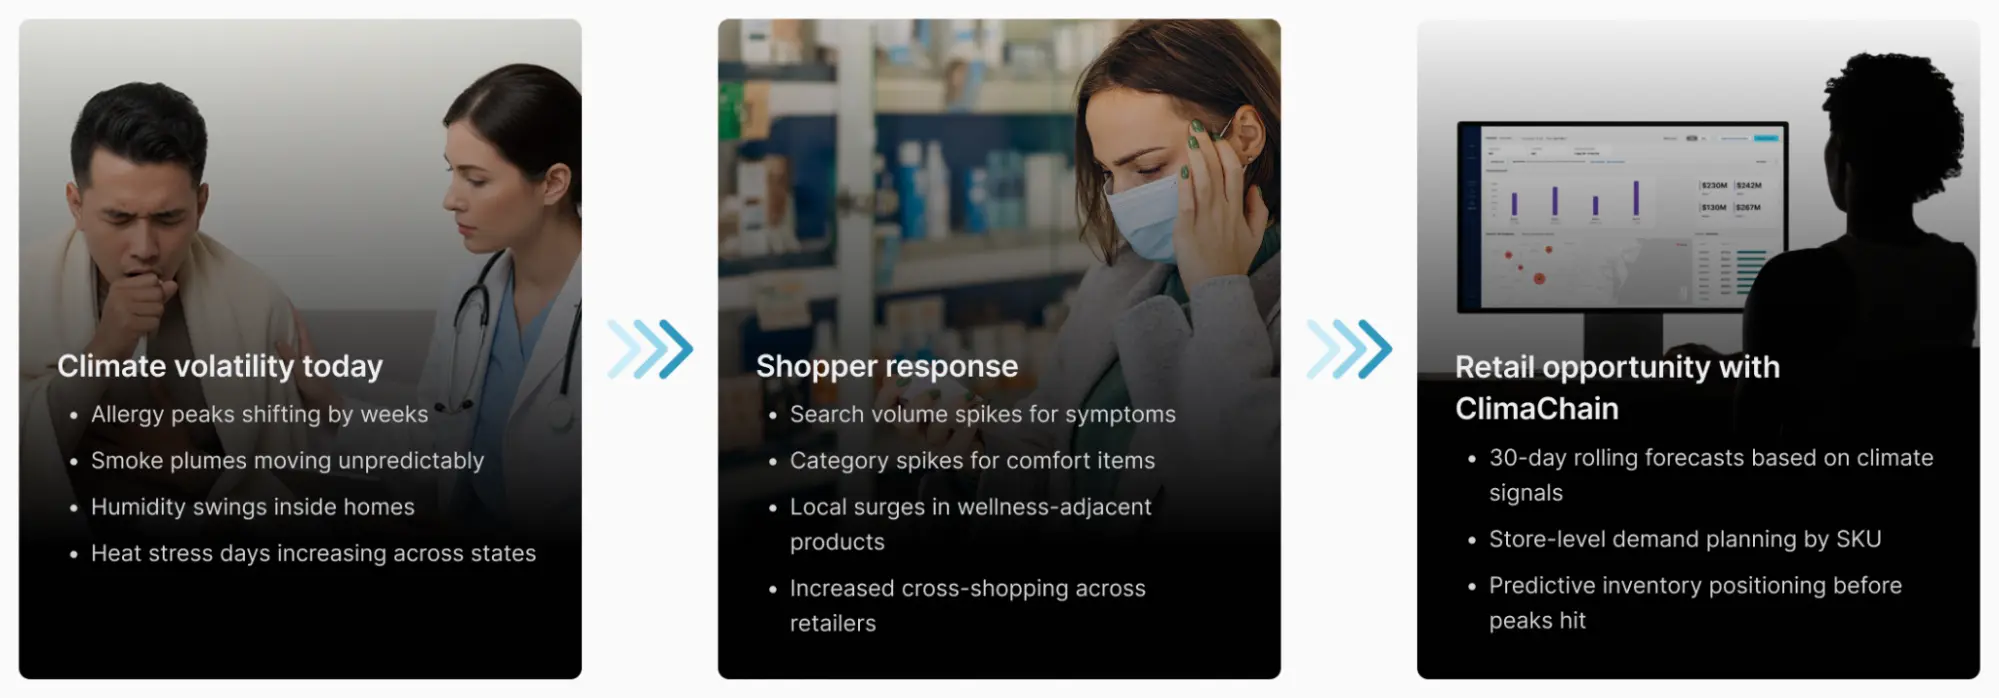
This is where the story becomes interesting. Retailers have traditionally relied on seasonal calendars to anticipate these waves. But climate-driven behaviour no longer follows a calendar.
Allergy peaks arrive early or late. Wildfire smoke crosses states overnight. Humidity inside homes collapses without warning. Heat waves that were once mild now rupture into multi-week spikes. Consumer discomfort has become irregular, hyperlocal, and nearly impossible to forecast with legacy planning.
Which is exactly why environmental intelligence matters.
ClimaChain tracks air quality, pollen, humidity, heat shifts, and climate volatility in real time across millions of locations. When retailers layer these signals on top of major sale days, they stop gambling on old seasonality and start responding to real-world conditions that are unfolding hour by hour.
Context-aware retailers win more deals than those with the biggest inventories.
If a smoke plume sweeps across the Midwest three weeks earlier than usual, retailers can surface purifier filters, hydration mixes, and sinus-friendly products long before competitors react. If indoor humidity in the Northeast drops below 30% one week into October instead of November, humidifiers and nasal rinses can be bundled instantly. If North Dakota’s AQI spikes above 150 during Prime Day, shoppers there will behave nothing like shoppers in Florida or California.
Climate volatility reshapes what people need. Sales-day traffic amplifies what they buy.
Environmental intelligence is the bridge between the two.
If you zoom out across the patterns we have uncovered, the narrative becomes clear.
People think they are buying a humidifier for better sleep, a protein shake because it is trending, or a new set of filters because the old ones seem dirty. But underneath those choices sit climate signals and health discomfort.
This is why prices shift when they do. It is why stock levels behave unpredictably. It is why wellness-adjacent items now dominate major sale events.
We are responding to the environment almost instinctively, and our online carts quietly record the story.
The change we need to implement now is for retailers to interpret those signals through real-time climate intelligence.
ClimaChain helps you spot what's driving demand before it spikes by integrating climate signals directly into your planning systems.
If you're curious about what's already affecting your sales, we'll run a free demo across 5 of your stores and show you the climate patterns tied to your SKUs and regions. No strings attached. Just real insights you can actually use.
Book a free pilot and see what you've been missing.