Get the most reliable climate data
Oops! Something went wrong while submitting the form.


As climate change reshapes sport, the question is no longer if athletes will be affected but how well they’ve prepared for it. Global tournaments face escalating heatwaves, worsening air quality, and unpredictable pollen surges. Through collaborations with experts like Dr. Naomi Datson, Ambee’s climate intelligence helps teams analyze years of temperature, humidity, air quality, and pollen data to anticipate risks and adapt strategy.
{{key-insights}}
Usually, when athletes arrive for an event as massive as the Olympics, the question circling in their minds is simple: Will I perform at my best? In Paris 2024, that question came second.
Inside the much-celebrated, eco-designed Olympic Village built to run without air conditioning, temperatures rose past 35 degrees Celsius. Rooms became too hot to rest in. Athletes soaked towels in cold water and slept under them.

As scrutiny grew, Paris Mayor Anne Hidalgo said, “I have a lot of respect for the comfort of athletes, but I think a lot more about the survival of humanity.” Yet what unfolded in reality offered neither comfort nor sustainability.
The absence of cooling gave birth to a “two-tier Games,” where some delegations rented portable cooling units; others couldn’t afford to.
In the process, a simple truth surfaced: climate conditions no longer sit in the background of sport. They decide how fairly it can be played.
The story might have read differently. Ambee’s team revisited real-time temperature and humidity data from Paris during the 2024 Olympic window. The heat and humidity curves told the same story as the athletes did.
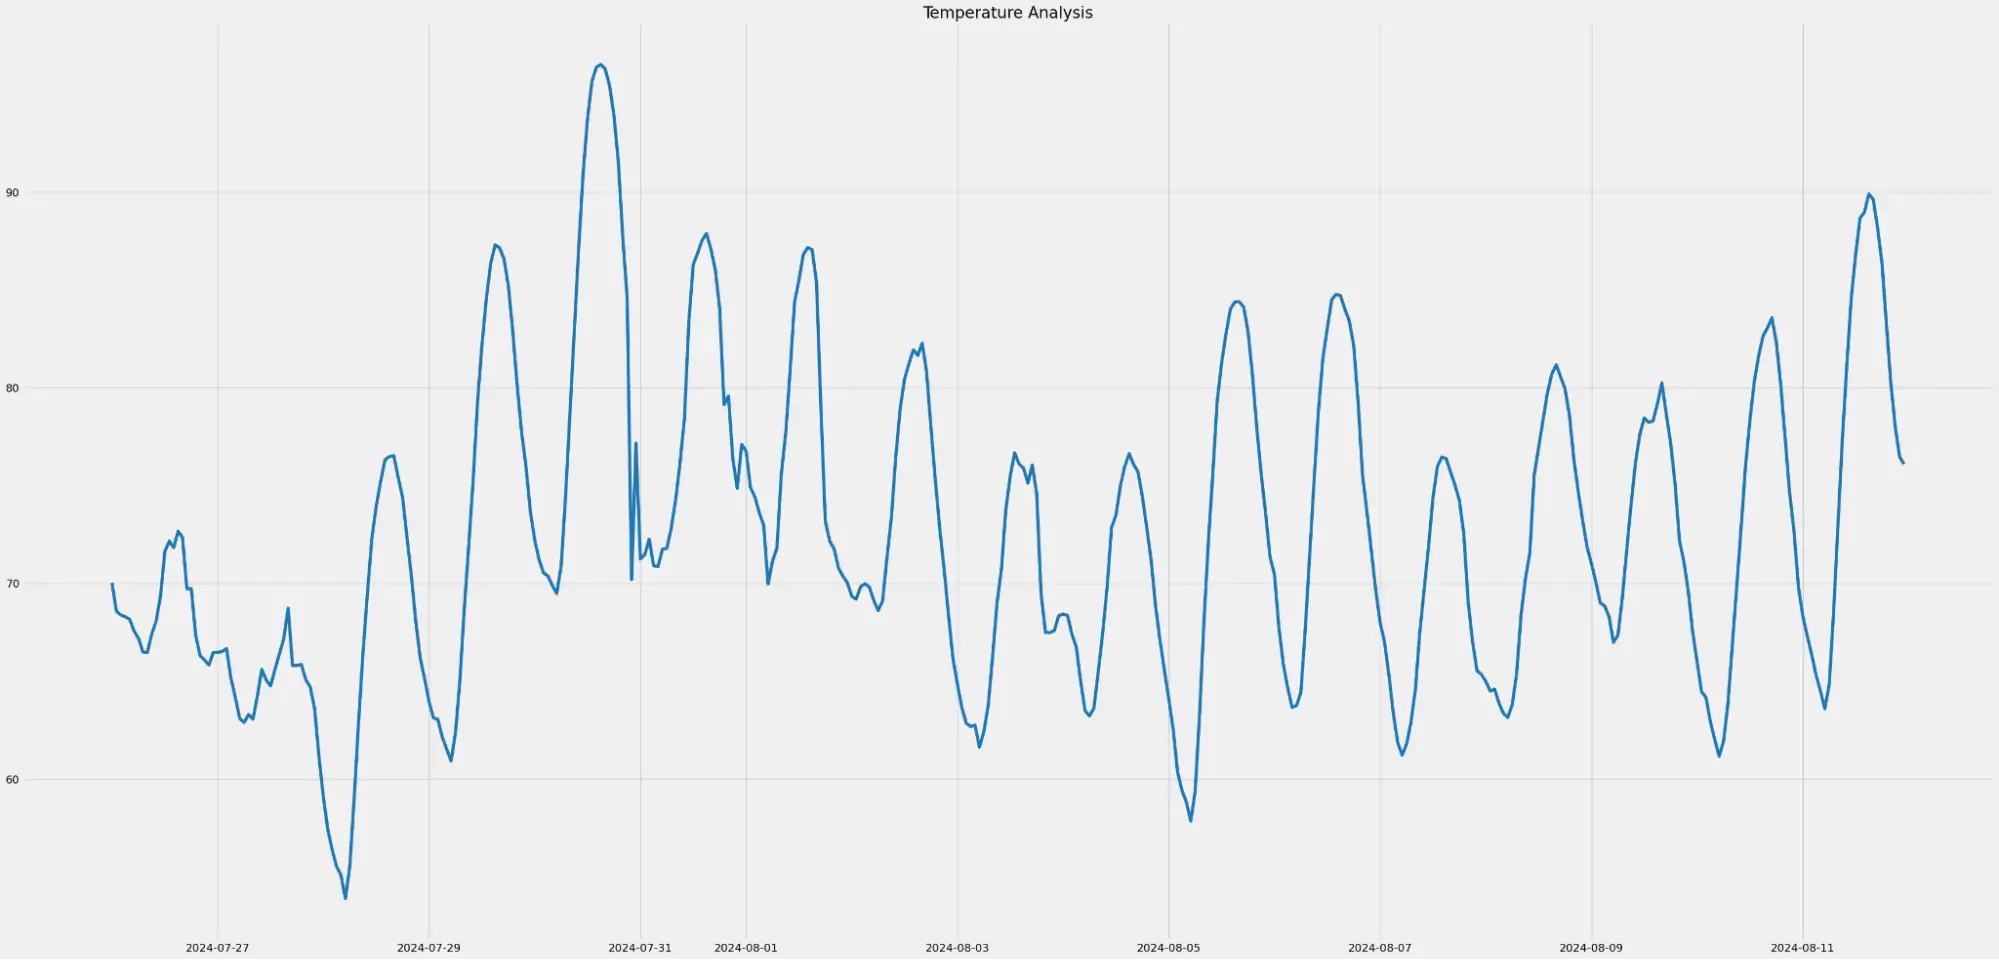
It’s proof that having access to this kind of verified environmental intelligence means anyone can plan and prepare for these spikes.
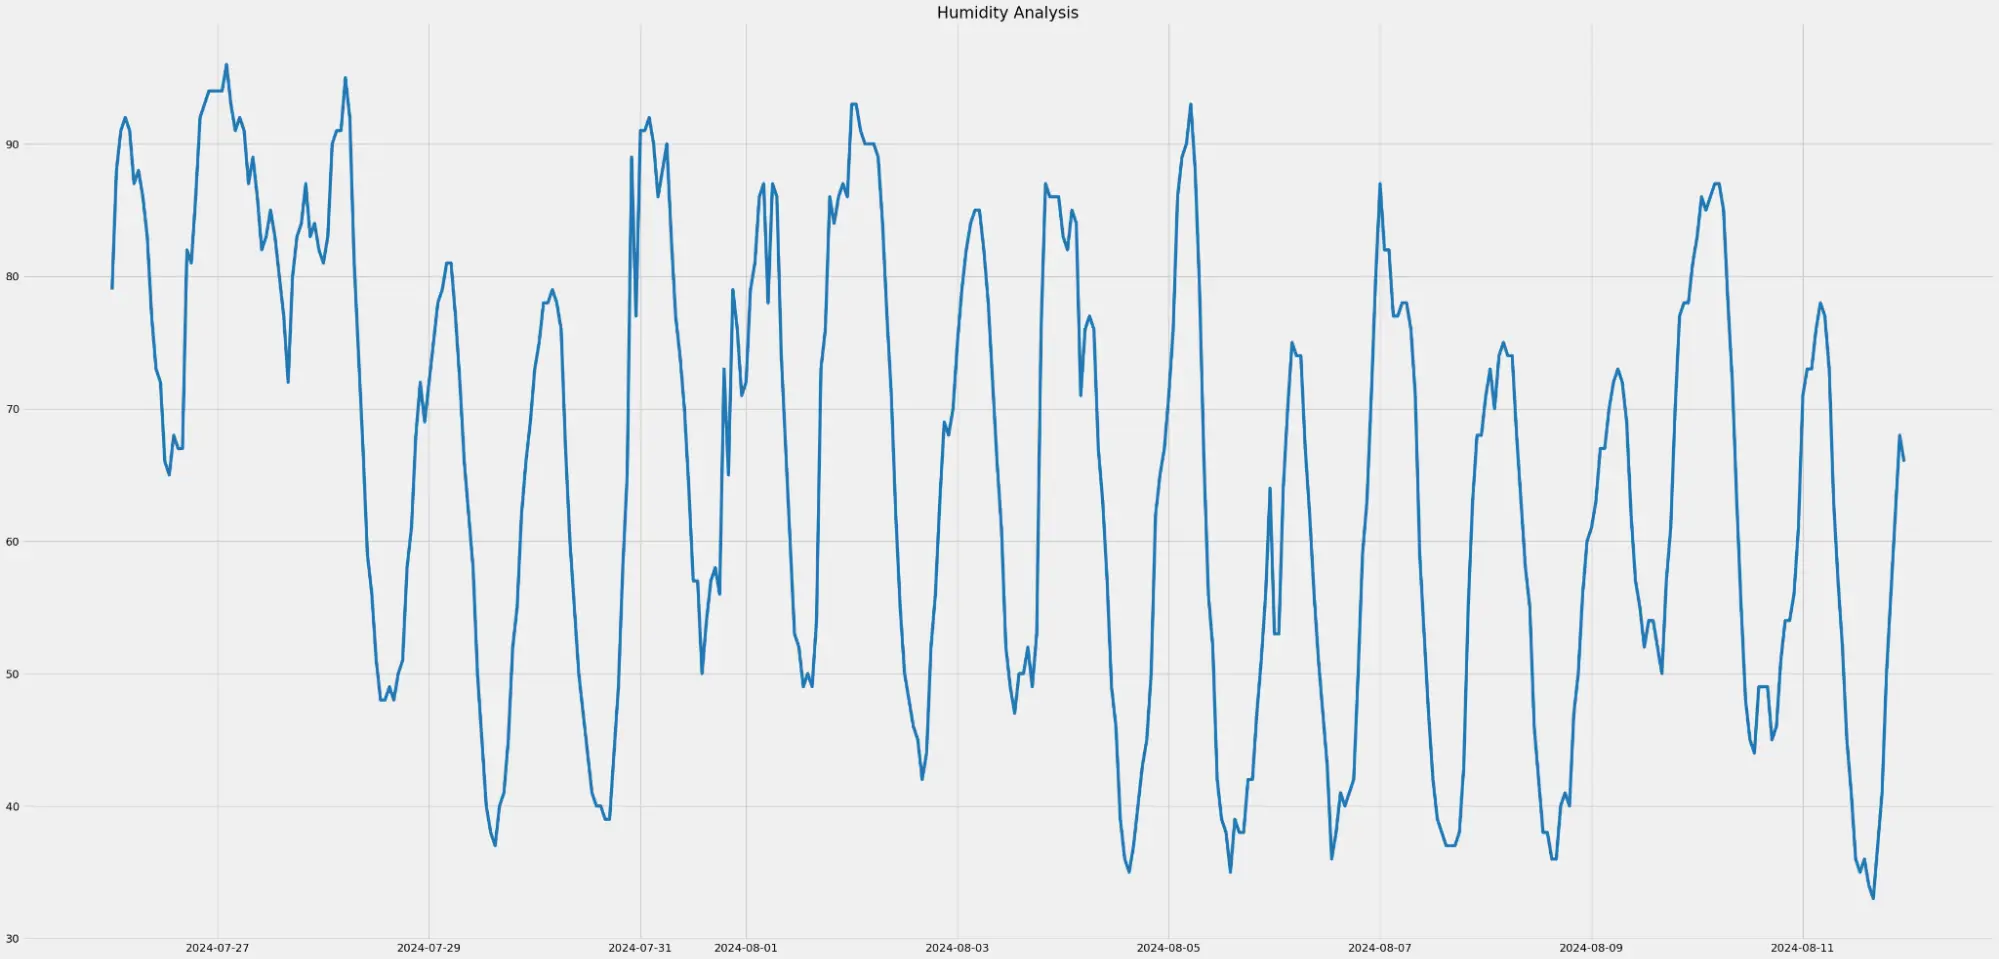
With intelligence like this, a team could know when to train, when to hydrate more aggressively, and when to delay recovery runs. For organizers, it means a more informed strategy for efficient behind-the-scenes.
It’s now evident that the more a team knows, the better it can train. But data alone, in isolation, is of little use. The numbers have to match the need.
To understand which parameters truly matter in elite sport, we spoke to Dr. Naomi Datson, Senior Lecturer in Applied Sport and Performance at Manchester Metropolitan University.
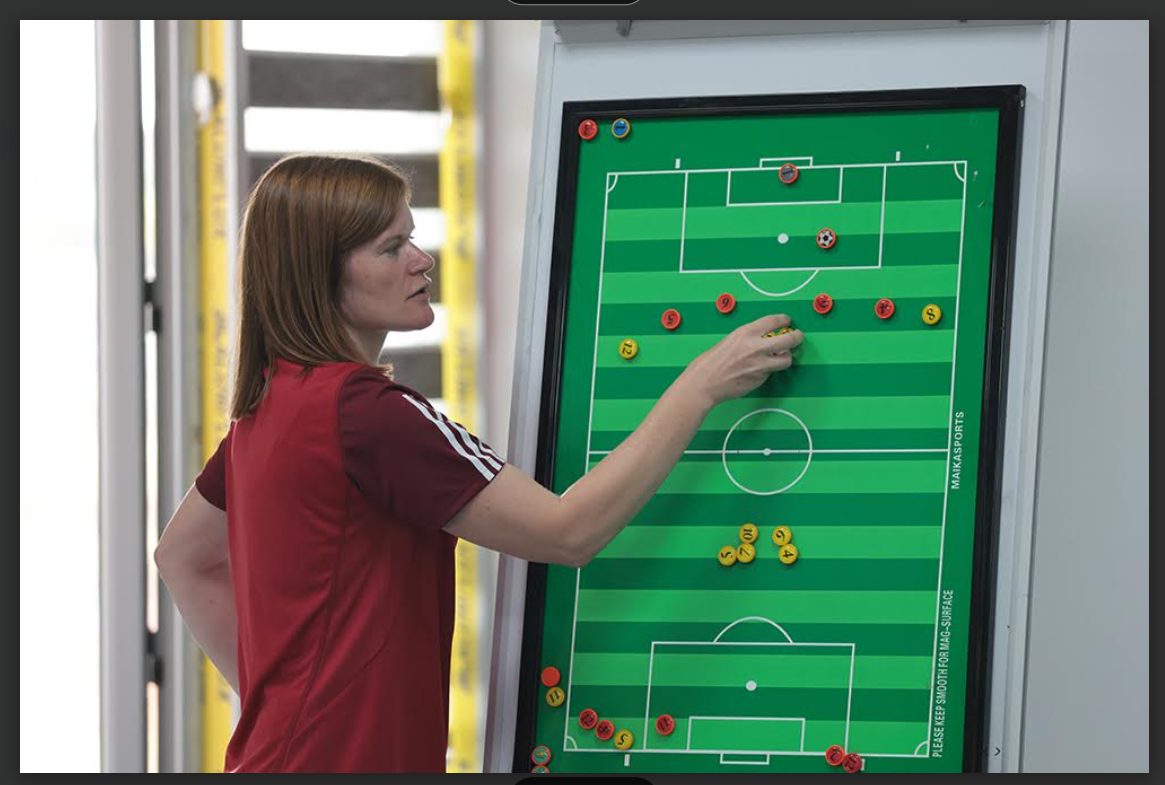
Dr. Naomi works with an elite football club based in London to help them prepare for tournaments overseas. Her team used Ambee’s actionable climate data to explore how environmental conditions could shape physical readiness and match-day performance.
At the heart of their research was a simple question: “What will the environment really feel like when the team gets there, and how can they train for it?”
This is where Ambee’s data became the foundation of Dr. Naomi’s research.
Through Ambee’s multidimensional climate insights, her team accessed five years of high-resolution climate data that included temperature, humidity, air quality, precipitation, and pollen counts. Each dataset was mapped precisely to the international venues and match dates relevant to the club’s competition schedule.
But why did Naomi need five years of data?
Short-term weather data might reveal a hot week or a cold snap, but it can’t tell whether those spikes are rare or part of an emerging pattern.
Ambee’s datasets revealed outliers such as the 2022 European heatwave, unexpected humidity spikes, and short-lived pollen surges that could easily disrupt training or match play.
“It’s important to see the averages, but also the potential maximums, because that’s what preparation is really built around. When we compared it to London, it gave the players context. They could immediately understand whether it would feel similar or much tougher.”
- Dr. Naomi Datson, Manchester Metropolitan University
This long-range perspective allowed researchers to identify “red-flag” periods weeks in advance.
At the same time, the team could compare their familiar home conditions in London with the vastly different climates they would face abroad. Whether it was the drier air and higher heat or fluctuating humidity and pollen loads.
The analysis enabled coaches to:
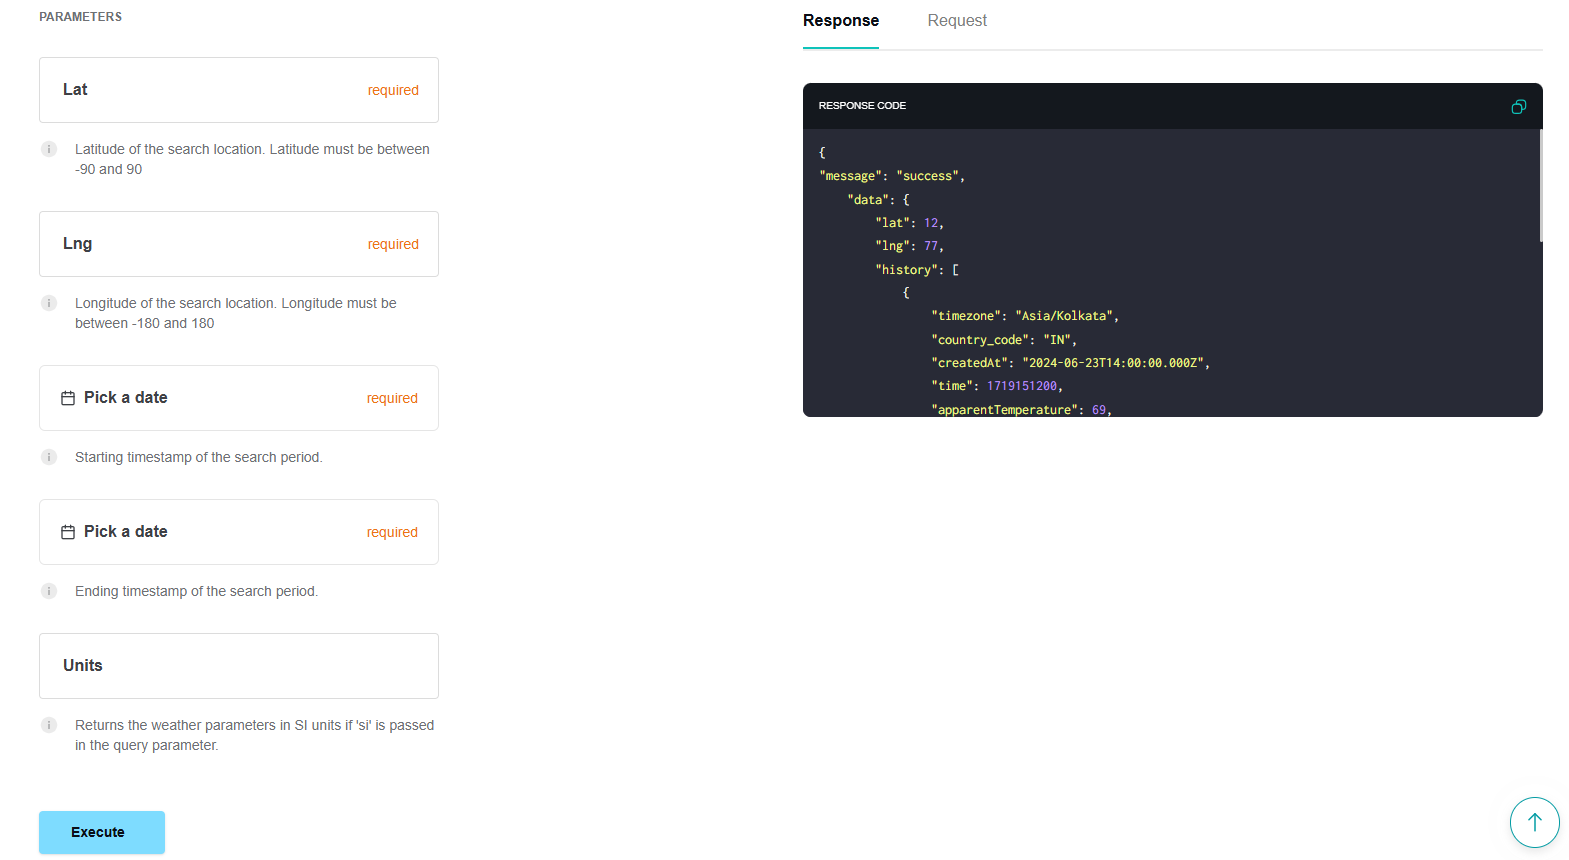
For anyone interested in exploring how environmental data translates into insight, the Ambee Playground offers a simple way to experiment with real conditions across regions and timelines.
Once on the playground, just enter a few simple inputs: Location, time frame, and the parameters they wanted to study. This two-second copy-paste code-work generates a complete environmental profile of the destination.
According to the World Economic Forum, higher air temperatures are already influencing outcomes in ways few could have predicted.
While many of these effects are detrimental to endurance, they don’t always tilt the scale negatively. In some unique cases, they can actually work in the athletes’ favor.
What truly matters is foresight: having the right data in advance to understand when those shifts will occur and how to adapt to them, rather than being caught off guard mid-competition.
{{quotation}}
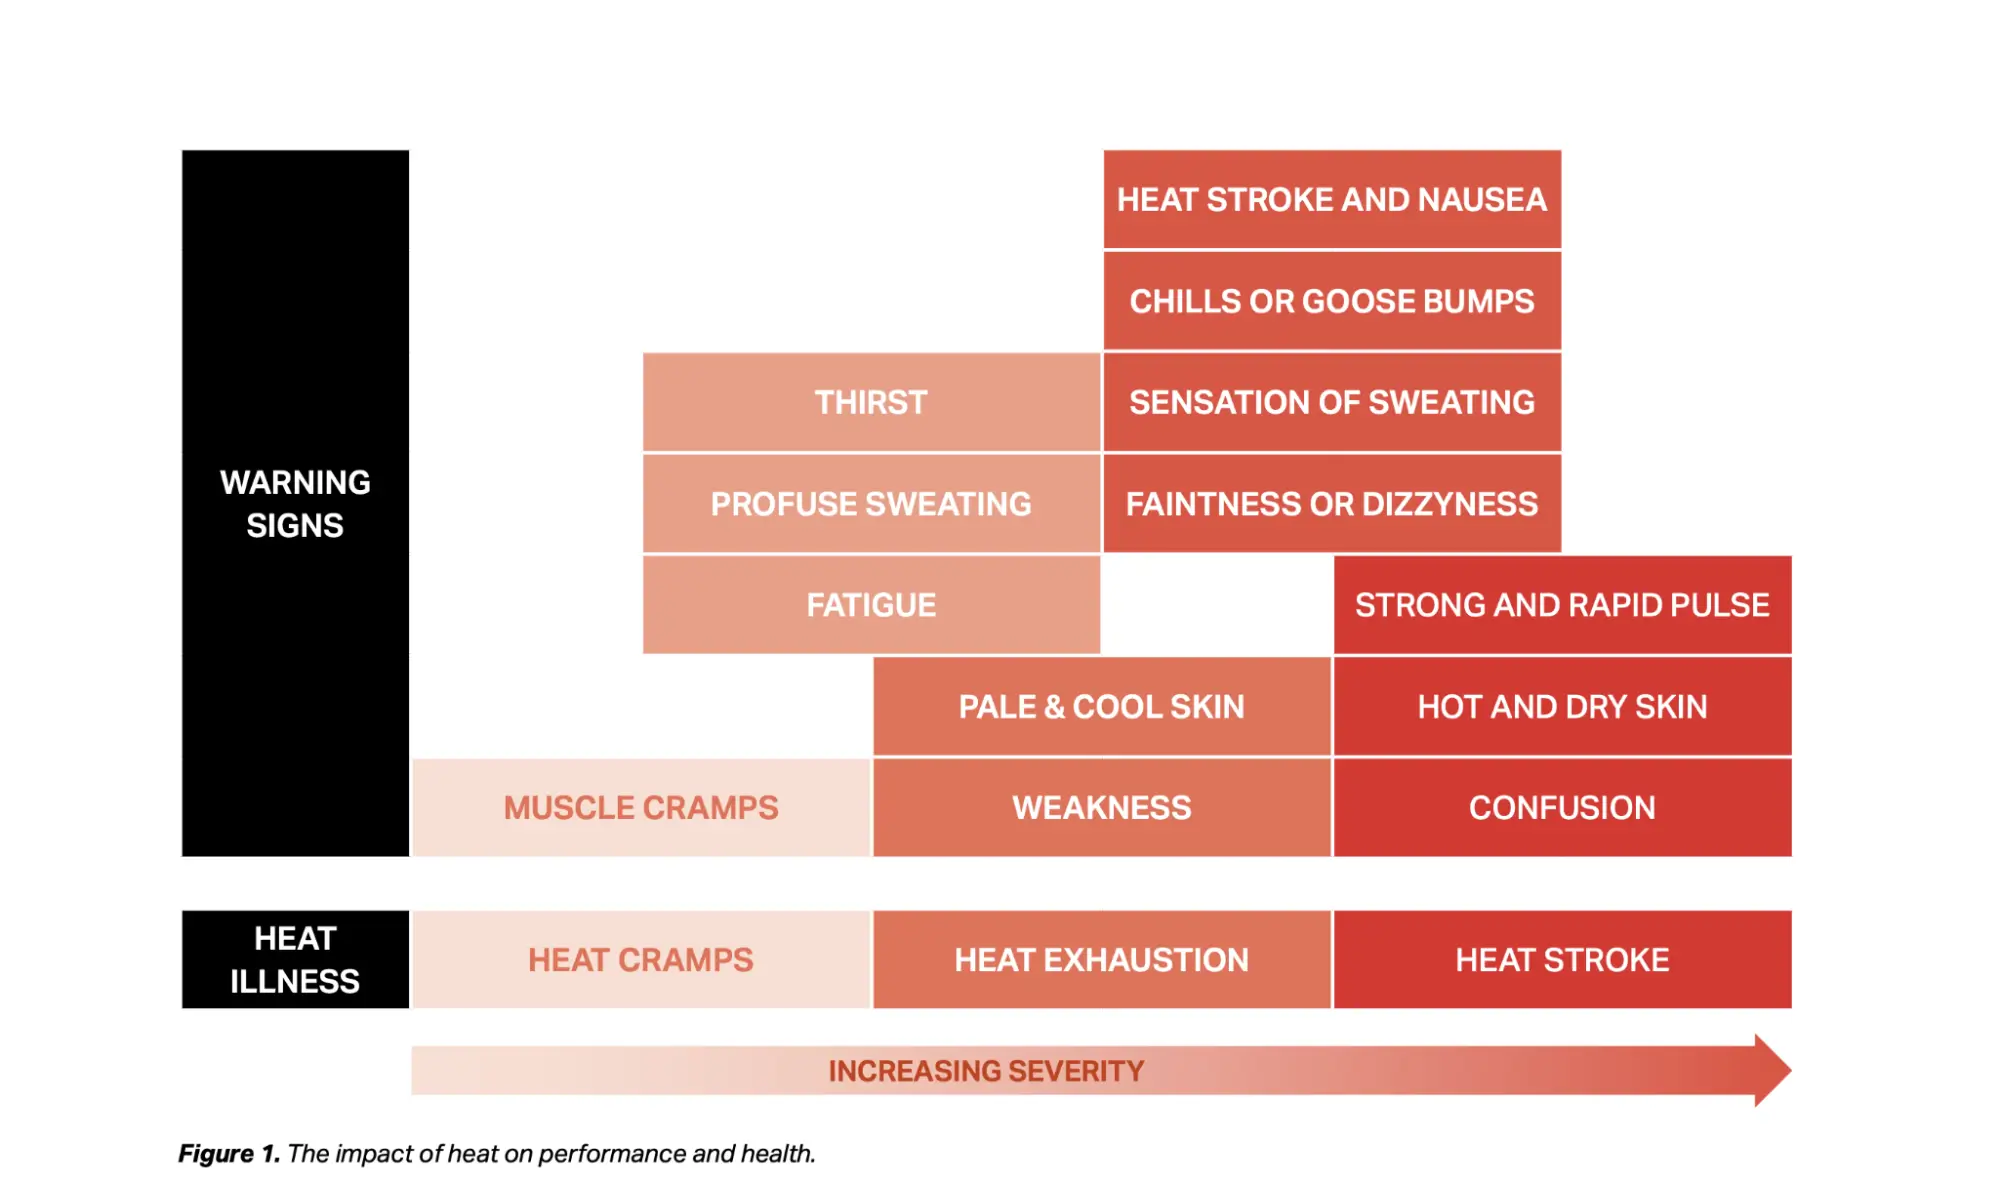
Every variation in temperature, humidity, and air quality leaves a measurable imprint on both the body, environment, and how fans experience sport.
The table below captures those ripple effects:
On the hottest days of the men’s race last year at the Tour de France, temperatures climbed close to 40°C. As a result, many cyclists experienced symptoms of heat-related illness as their core body temperature rose beyond safe limits.
Road temperatures reached up to 140°C, forcing organizers to spray water on melting asphalt and add extra feed zones to maintain hydration.
It's not just the recent past: During the Tokyo 2021 Olympics, researchers recorded 225 cases of heat-related illness, including 100 athletes and 125 spectators. A follow-up epidemiological study found an overall incidence of 8.6 cases per 1,000 athletes.
Continuous climate monitoring can identify heat risk zones along a route weeks in advance, enabling organizers to adjust start times, hydration intervals, and medical staffing.
The natural consequence of these cases, and the potential risk to players’ health, is that the focus has now shifted from reacting to heat to planning for it.
At the regulatory level, bodies such as the Union of European Football Associations (UEFA) have established temperature thresholds. Cooling breaks apply when the Wet Bulb Globe Temperature (WBGT) exceeds 32 °C.
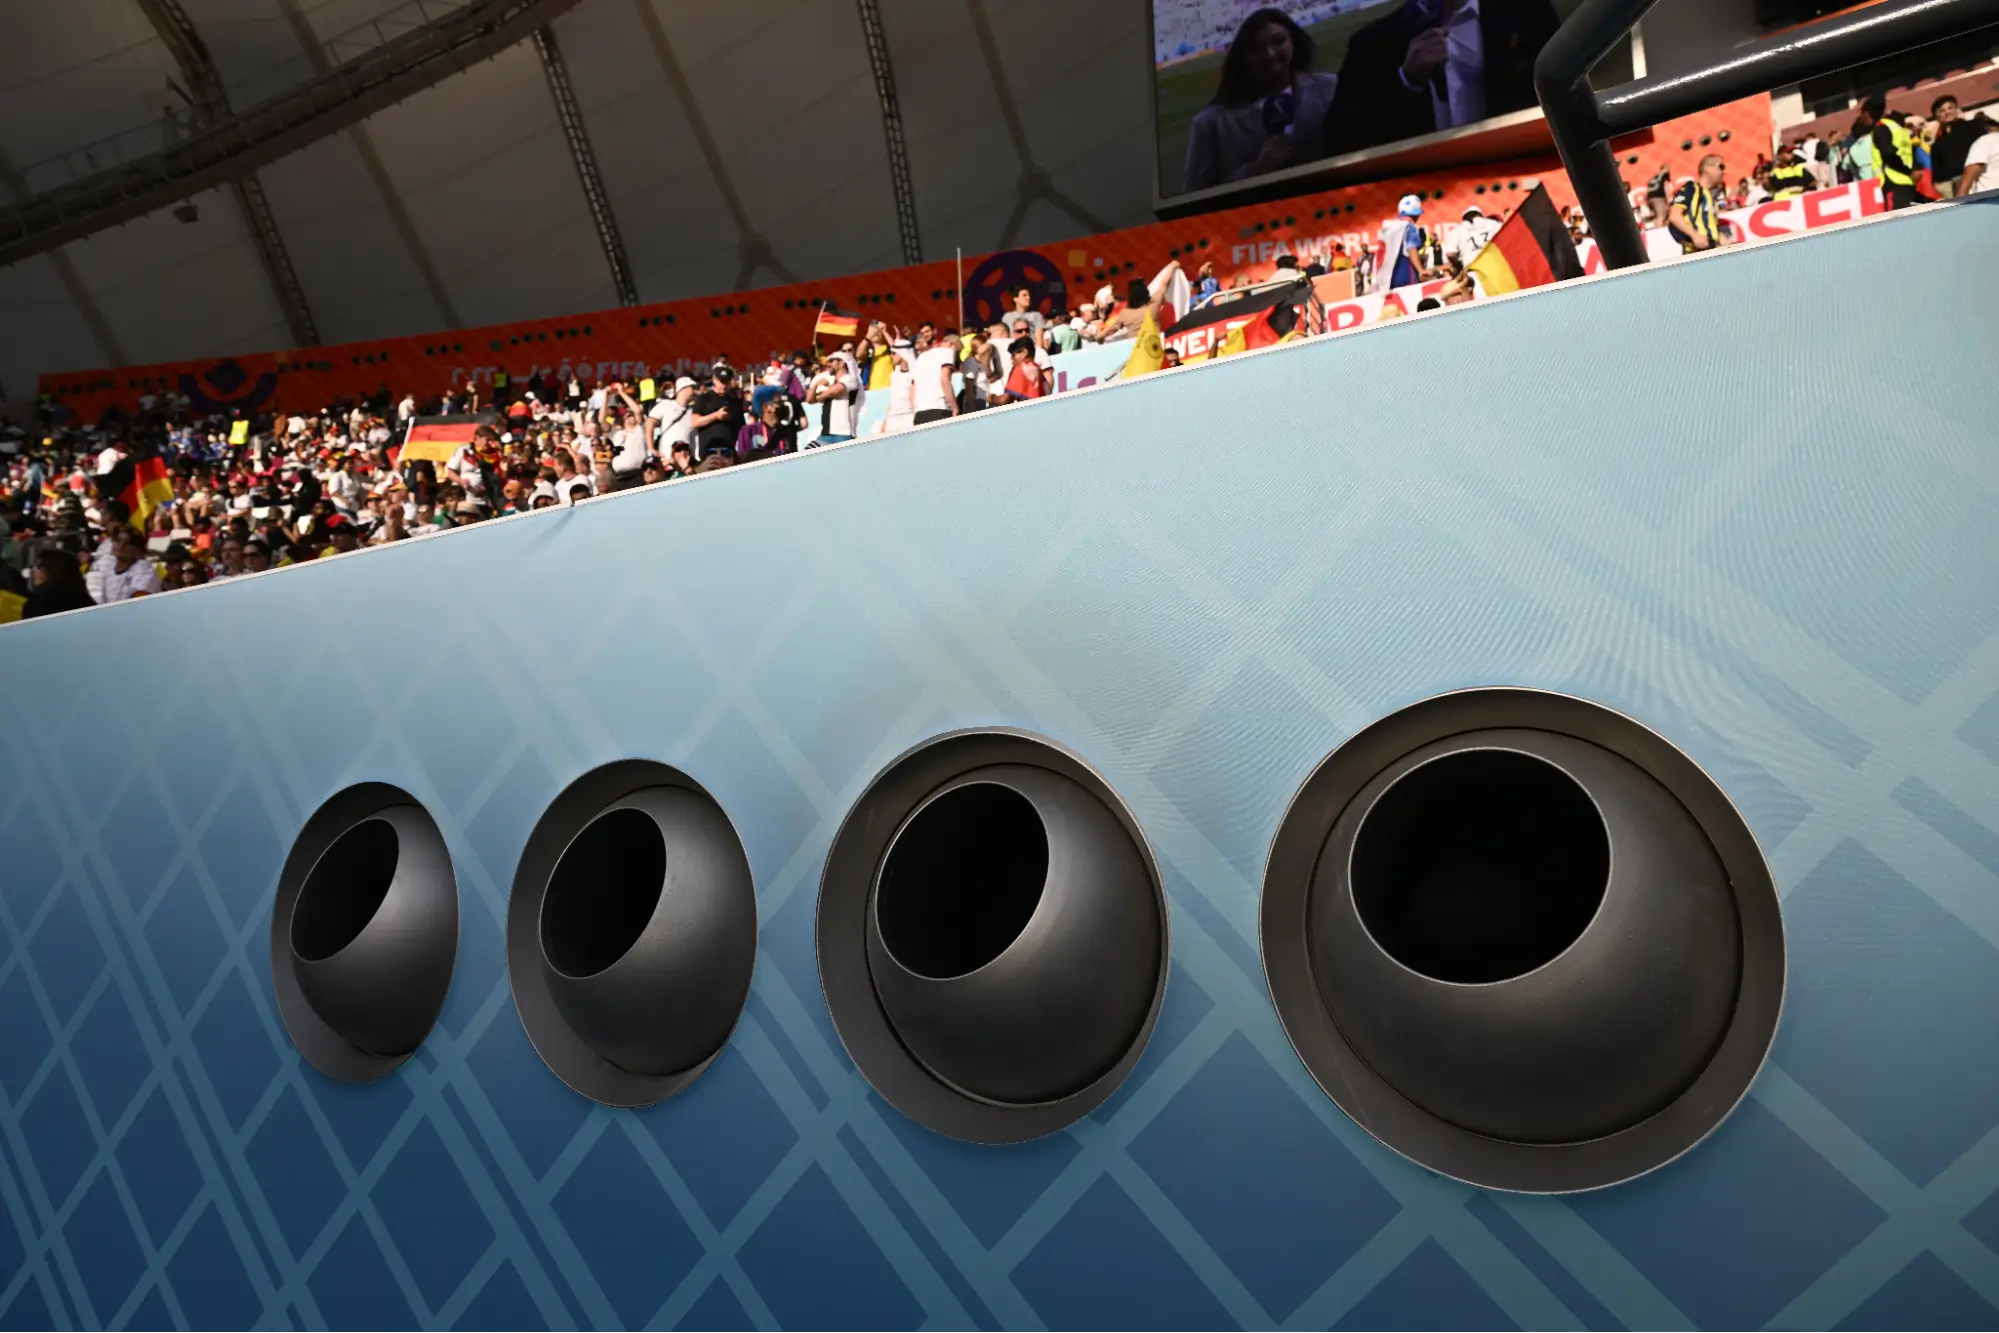
During the 2022 FIFA World Cup, Qatar moved the entire tournament to the winter months to protect athletes from extreme heat exposure. And when daytime temperatures still averaged 26–28°C, organizers installed solar-powered air-conditioning systems that cooled both the pitch and spectator areas.
In our conversation, Dr. Naomi Datson shared her perspective on how climate intelligence is changing the way elite teams prepare for global tournaments.
Q. Why did your team look at heat preparation before travel?
A. If you know that the players are going to go to an environment that is going to be challenging for them, it’s important to prepare for that… either do acclimatization by going earlier or acclimation at home in an environmental chamber.
Q. Should this move beyond temperature to include air quality and pollen?
A. I think it will be really interesting to see if things like air quality, pollen, those kind of things begin to feature more heavily.
Recent research strongly supports that view.
Exposure to particulate matter, especially PM2.5, is linked to reduced hemoglobin levels, elevated blood pressure, and diminished lung capacity over time.
Analyses of Major League Baseball and NFL data found that players competing in regions with poorer air quality committed significantly more fielding errors and interceptions.
For individuals with pre-existing respiratory sensitivities—such as asthma or allergies triggered by pollen—these conditions magnify risk and impair performance further.
Ambee empowers teams to integrate hyperlocal air quality and pollen data directly into planning and protocols. By mapping AQI and pollen forecasts along match venues or travel routes, medical and performance teams can recommend protective measures or shift outdoor sessions.

Q. Does better preparation also reduce injury risk?
A. There obviously is a link… injuries are multifaceted, but if we have players that aren’t prepared for those environmental conditions, then potentially there’s an increased risk… our plan is to make sure players are as prepared as possible for a performance reason and an injury reason.
Scrolling through social media today reveals a clear pattern: professional athletes are increasingly hyper-conscious of what they put into their bodies and the lifestyles they lead.
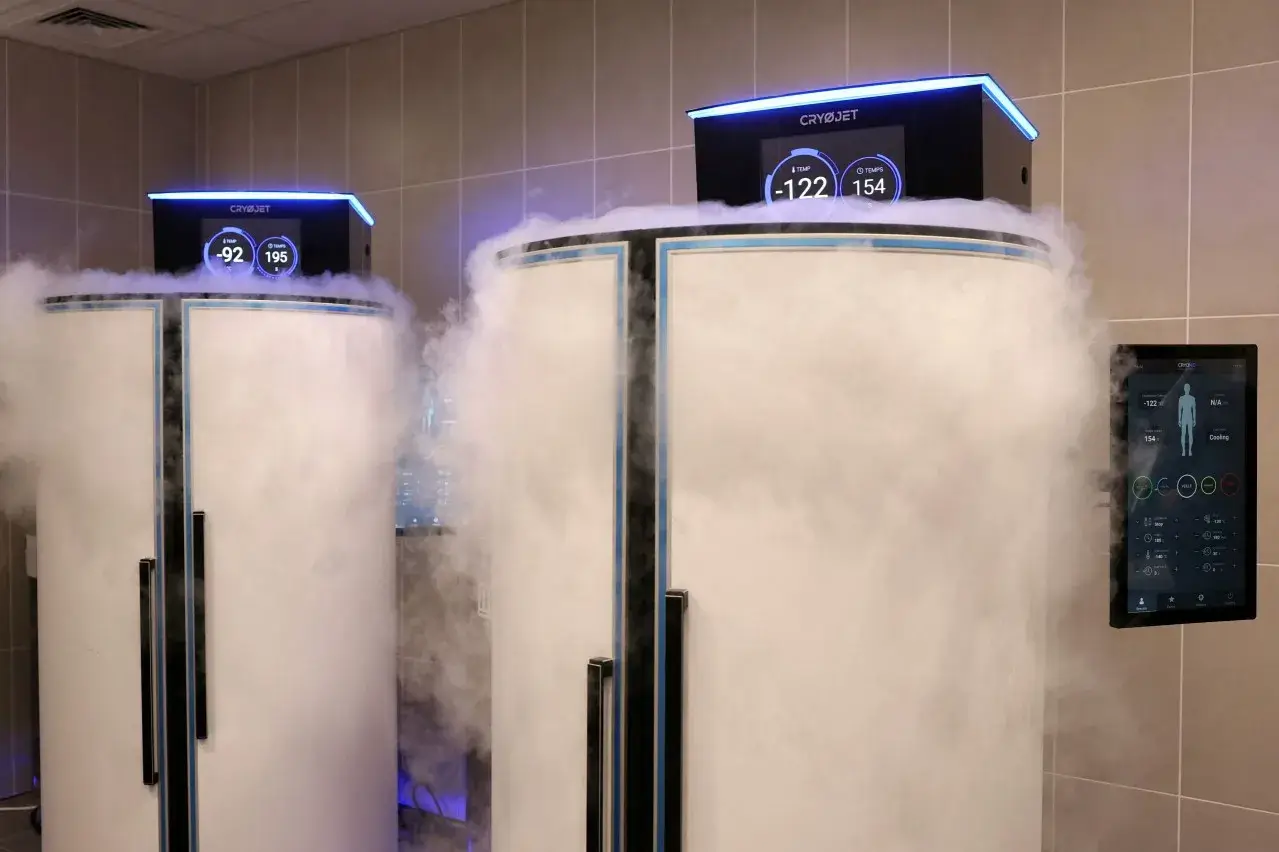
Jamie Vardy of Leicester City, for instance, follows a meticulously structured recovery plan that includes cryotherapy, hydrotherapy, and a signature pre-match ritual of three Red Bulls, a double espresso, and a cheese-and-ham omelette to keep him sharp well into his late thirties.
Even retired legends like David Beckham continue to model this mindset, sharing weekend workout videos and recovery routines.
The point? Players care. Deeply.
The modern athlete is no longer just coached. From sleep and nutrition to workload and recovery, every variable is monitored, analyzed, and optimized.
And climate is the next frontier in that ecosystem.
As Ambee continues to turn raw data into readiness, environmental awareness becomes an active performance tool.
On an individual level, players can model heat stress risk weeks in advance, compare venues, or even plan training cycles around predicted pollen or pollution surges.
Dr. Naomi put it simply: “Knowledge is power.”
When players know what to expect, they approach competition with confidence and composure. Even when conditions change mid-game.
Hard work will always be the foundation of sport, but accounting climate volatility has to be part of the strategy.
Dr. Naomi explains that this awareness matters for everyone, from elite athletes to recreational runners. “It’s crucial regardless of where you operate on that spectrum,” she said. “If the environmental conditions you might face on any given day are known, you can make an informed decision. Maybe exercise earlier, train indoors, or simply prepare better. Being aware allows you to make the choice that’s best for you.”
Ambee allows you this kind of mental advantage with access to clear, reliable environmental insight.
Because climate is no longer a background factor, it’s part of the team.


![Best flood data providers in 2026 [Complete list & comparison]](https://cdn.prod.website-files.com/6281f31808e2aa515581d87e/697b512bf5c04ca781af12e9_flood-data-providers.webp)