Get the most reliable climate data
Oops! Something went wrong while submitting the form.


The Los Angeles wildfires smoke was more widespread and unpredictable because air pollution doesn't follow a straight-line geographic logic. Data from Ambee’s environmental intelligence showed that distant locations recorded the worst AQI spikes, with a 165% increase in peak pollution. Atmospheric transport and temperature inversions moved PM2.5 far from the flames. This confirms the need for proactive long-range forecasting to protect entire regions, not just fire-adjacent areas.
{{key-insights}}
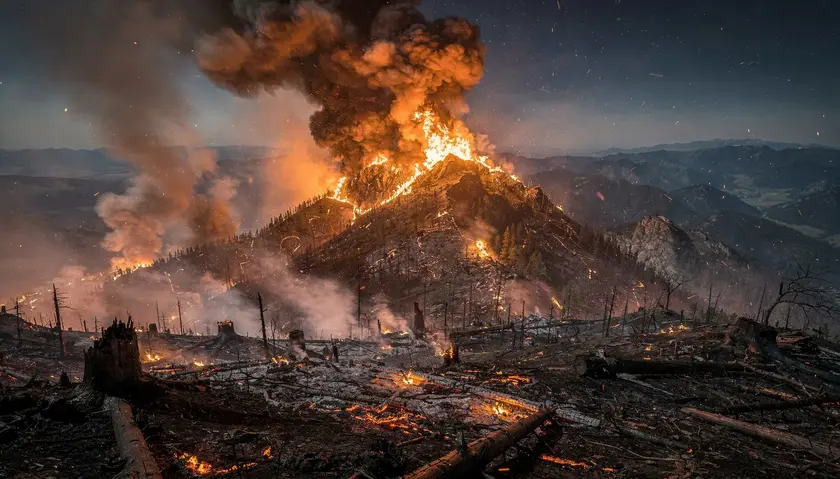
Wildfires are no longer isolated environmental disasters. They are regional—and often continental—public health emergencies. From California to Australia and now across Canada, fire seasons are intensifying, lasting longer, and affecting communities far beyond the flames.
The Los Angeles wildfires of early 2025 provide a revealing case study. Using high-resolution air quality and particulate matter data from Ambee’s environmental intelligence, we conducted a detailed multi-location analysis to understand how wildfire smoke disperses across space and time. The findings challenge conventional assumptions about proximity and exposure.
As you scroll, explore the AQI data from six strategically selected locations in and around Los Angeles. This interactive timeline lets you see how pollution traveled far beyond the burn zones, reaching neighborhoods miles away from the fire lines and exposing populations previously considered outside the immediate risk area.
From December 1, 2024, to January 19, 2025, air quality was monitored across six sites around Los Angeles. These sites were categorized by proximity to the fires:
Fire zone locations
Nearby locations
Distant locations
This spatial arrangement allowed us to observe how pollution concentrations varied by distance, and in some cases, how that relationship broke down entirely.
Use the interactive embed below to scroll through each week and explore how PM2.5 levels changed across these locations in real time.
{{firewidget}}
Despite their geographic differences, all six locations followed a consistent four-phase trajectory of air quality during the fire period.
AQI values rose from baseline levels of 40–50 to peaks between 60 and 80. This early spike marked the start of active fire events and was the first indicator of widespread smoke dispersion. Notably, even distant sites registered significant deterioration within the first week.
AQI levels dropped sharply, likely due to favorable weather conditions like wind shifts or rainfall. This phase showed how quickly air quality can rebound when meteorology is on our side.
All six locations reached their highest AQI levels during this period. The uniformity of this timing across near and far sites suggests a region-wide air quality event, potentially driven by both sustained fire activity and atmospheric conditions such as inversion layers that trapped pollutants near the ground.
Gradual improvement occurred across all sites, signaling either effective fire containment or a shift to weather patterns more conducive to dispersion. However, the path to recovery was uneven and slower in certain areas, indicating that pollution outlasted the flames themselves.
You can explore each site’s AQI journey in the interactive scroll section of this blog. Compare how trends evolved differently depending on location, and where the worst air was actually recorded.
The most surprising finding? Distant locations recorded AQI spikes on par with—or worse than—those in the direct fire zones.

This runs counter to general assumptions that air quality only deteriorates most close to the fire. In reality, several interrelated factors allow pollution to travel and settle in distant areas:
Smoke plumes can rise into the upper atmosphere and travel hundreds of miles before settling. Fine particulate matter (PM2.5) often remains suspended for long periods, eventually falling out over distant urban or rural areas.
Mountains, valleys, and built environments like urban heat islands shape wind currents and trap pollution. These patterns can concentrate smoke in areas that appear geographically disconnected from the fire.
Inversions occur when a layer of warm air traps cooler air near the ground, preventing smoke from rising and dispersing. This often leads to extreme pollution episodes in areas experiencing otherwise calm weather.
Use the interactive comparison map to see which locations experienced the worst pollution and how these zones shifted over time. What emerges is a picture of wildfire pollution that is far less predictable—and far more widespread—than public perception often assumes.
By June 2025, Canada was experiencing one of its most severe wildfire seasons in decades, with over 200 active fires and more than 2.6 million hectares burned. The impacts extended well beyond the fire fronts. Smoke from Manitoba and Ontario drifted across provincial lines and into the United States, blanketing cities in haze and prompting widespread air quality warnings.
Toronto, located hundreds of kilometers from the primary fires, experienced some of the most severe pollution levels globally. In fact, smoke from these fires was so extensive that it traveled across the Atlantic and reached the UK, a stark illustration of how far wildfire pollutants can move in the upper atmosphere.
Once again, the four-phase AQI pattern observed in Los Angeles played out: an initial spike, a short-lived dip, a prolonged peak, and a slow recovery. This repetition across borders and ecosystems confirms that fire-linked air degradation follows atmospheric logic more than geographic logic. It also underscores the urgency of preparing entire regions—not just fire-adjacent areas—for smoke impacts.

Retrospective data helps us understand what happened. But anticipating what’s next is the real challenge. That’s where forecasting tools come in.
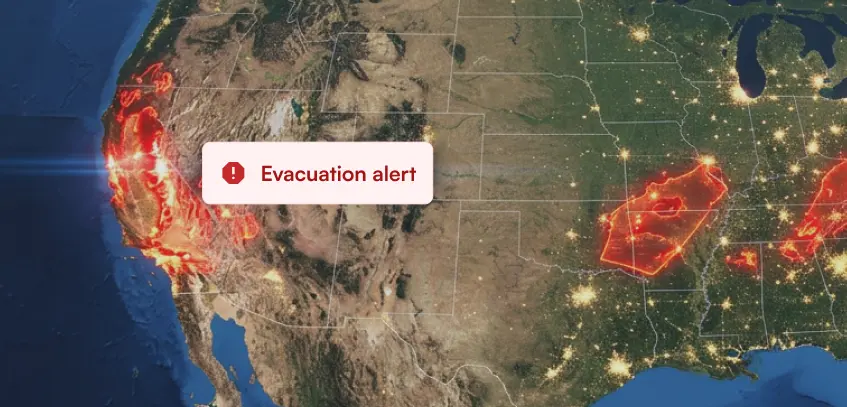
Ambee has developed a 30-day wildfire risk forecasting system that integrates:
By identifying where ignition risks are highest and where pollutants are likely to spread, this system empowers governments and communities to act early. Early warnings can shape resource allocation, guide public health advisories, and trigger timely evacuations.
The wildfire story is no longer just about fire. It’s about smoke, air quality, and the invisible risks drifting across cities and borders. The Los Angeles wildfires showed how air pollution doesn’t follow a straight-line logic. The Canadian wildfires confirmed that pattern.
The conclusion is clear: long-range forecasting, combined with real-time AQI monitoring, is essential. Public health systems must expand their definition of “at-risk” areas. As fire seasons grow longer, more frequent, and less predictable, the ability to see what’s coming—and act before it arrives—will define our resilience.