Get the most reliable climate data
Oops! Something went wrong while submitting the form.


Ambee Maps is a groundbreaking interactive platform that helps users worldwide track air quality, pollen data, and wildfire information with street-level granularity. The platform visualizes key parameters like PM2.5, NO2, and the Air Quality Index (AQI), adhering to standards set by the US EPA and National Allergy Bureau (NAB). Individuals and businesses can use Ambee Maps for continuous air quality monitoring and effective route planning by viewing historical data over the last 48 hours and pollen forecasts. Ambee provides solutions to make proactive decisions for a healthier world.
{{key-insights}}
📢 We are thrilled to announce the launch of Ambee Maps, a groundbreaking interactive platform powered by Ambee data. Ambee Maps allows users to track air quality, pollen data, and wildfire information through interactive visuals, offering a comprehensive overview of environmental conditions for locations worldwide.

With Ambee Maps, individuals and businesses alike gain invaluable insights into surroundings down to the neighborhood level at a global scale. This empowers proactive decision-making while fostering a healthier, safer world.
Ambee Maps allows users to track air quality, pollen, and wildfire data in interactive visuals. Here is a detailed breakdown of the information available on the platform.
Ambee’s air quality map visually depicts air quality data, including parameters such as PM10, PM2.5, CO, NO2, SO2, O3, and more, with street-level granularity. It also provides Air Quality Index (AQI) values so users can understand the air quality around them easily.
The AQI is determined by data gathered from monitored air quality stations and is split into categories such as Good, Moderate, Unhealthy for Sensitive Groups, Unhealthy, and Hazardous. Ambee uses US EPA-compliant risk levels for AQI.

Ambee's pollen map offers detailed insights into the types of pollen present—tree, weed, and grass, their concentration levels, and corresponding recommendations. They are further broken down into sub-species level information.
These features facilitate easy assessment of allergen severity. Ambee's pollen maps adhere to the standards set by the National Allergy Bureau (NAB). They are meticulously designed to comprehensively overview pollen types and sub-species at a zip-code level.

Ambee provides users with up-to-the-minute information on wildfires. The information includes the location, intensity, size, fire confidence level (low, nominal, high), source/fire type (reported or detected by satellite), and detection date. Other parameters also include Fire Radiant Power (FRP) and Fire-Weather Index (FWI) around the selected locations.
The user can select the location of their choice for any point on earth at the top left side of the screen. This allows the user to access various features and detailed information on the location of their choice.
The user can switch between datasets, mainly air quality, tree pollen, grass pollen, and weed pollen, from the dropdown box at the top center of the platform.
Once the location has been entered, on the left side of the screen, the user will find a further breakdown of the dataset they have selected.

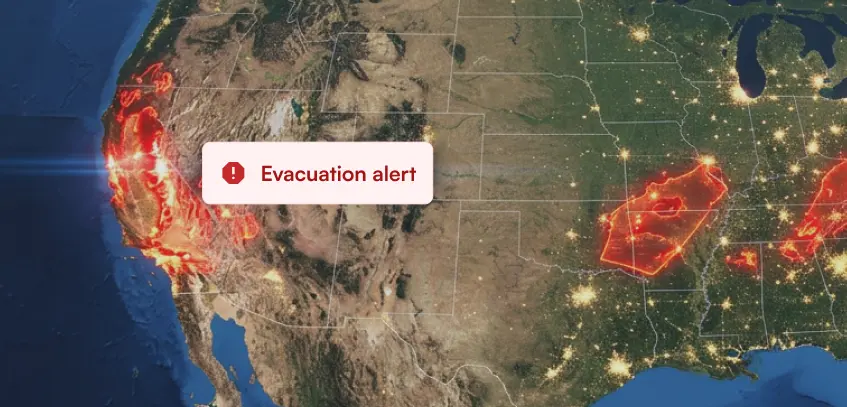
The users are also able to view wildfire activities in and around their location. In case of wildfires, a dialogue box will appear stating that wildfires have been detected in that area. The box can be further clicked to find extensive details on ongoing wildfires.

At the bottom left of the screen, users can view the historical timeline for air quality, tree pollen, weed pollen, and grass pollen over the last 48 hours.
For pollen, the user is also able to see the forecast data for the next 12 hours.

To make Ambee’s datasets universally acceptable, Ambee provides three standards for AQ data measurements—US, UK, and India. Users can switch between these at the bottom right side of the screens. The legend helps users understand the severity levels of the air quality.

The user can easily integrate Ambee Maps for their benefit. Users will need to click the “Get Ambee Maps” option at the top right corner and choose the option that best suits them.
While the list of use cases for Ambee Maps is endless, we’ve listed down a few ways you can make the best of it. You can use Ambee Maps for:
But we're not stopping here. At Ambee, we are committed to continuous improvement and innovation. Stay tuned for upcoming features on Ambee Maps, including versatile layers, support for geo-tiff files, and the introduction of tiles as a service. We're redefining how we navigate and interact with geographical data, setting a new standard for map services in the digital landscape.
Visit Ambee Climate Maps today and experience the future of climate intelligence firsthand.