Get the most reliable climate data
Oops! Something went wrong while submitting the form.


"The hospital is already at capacity, and we are very much stretched to our limits. Unfortunately, I think we're probably just at the tip of the iceberg when we're talking about this surge."
— Dr. Erin Beaumont, Emergency Department Director, Newton-Wellesley Hospital
We're still carrying the weight of what COVID-19 put us through. The isolation, the fear, the losses we couldn't process. And now, before most of us have had a chance to catch our breath, influenza is hitting harder than it has in decades.
According to the CDC, this flu season has already resulted in at least 18 million illnesses, more than 230,000 hospitalizations, and over 9,300 deaths across the United States.
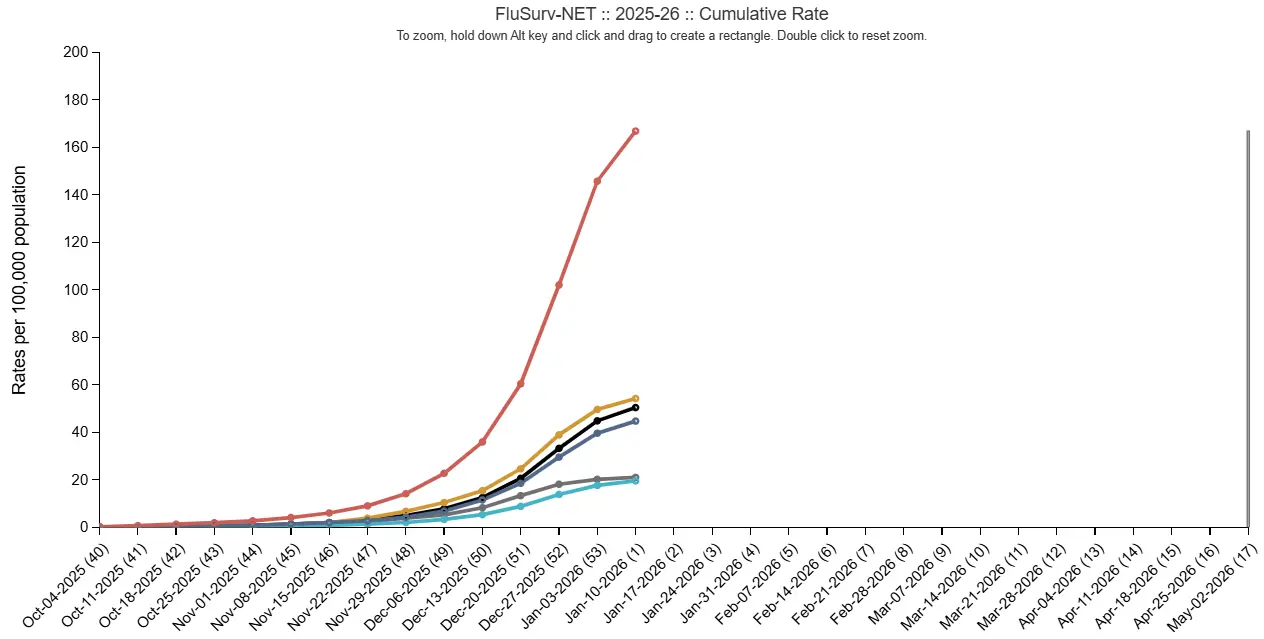
Children are not spared. By the second week of January alone, more than 15 flu-associated deaths among children were reported, bringing the total pediatric deaths this season to 32.
In situations like these, the healthcare and pharmaceutical sectors face crushing pressure from every direction. Emergency departments are operating at or beyond capacity, with patients waiting hours for beds that simply don't exist.
Healthcare workers are getting sick themselves, shrinking the workforce precisely when demand surges. And pharmaceutical supply chains are straining under sudden spikes in demand for antivirals like oseltamivir, creating localized shortages in the hardest-hit regions where families need them most.
Based on our research, we've observed that ILI risk forecasts can take some of that load off and give teams a real chance to prepare when circumstances feel anything but predictable.
So we decided to put our forecasts to the test against actual outcomes to see if Ambee's ILI risk data could be the early warning system healthcare and pharma teams have been missing.
Starting in early January, we began tracking our ILI risk forecasts on a weekly basis and comparing them against actual outcomes published by official U.S. government health portals like the CDC.
We wanted to see if our data was showing the same signals in the same places at the same time. Not just close enough, but genuinely aligned with what was actually happening on the ground.
Week after week, the patterns held. Where our forecasts showed risk rising, official reports confirmed surges. Where we showed regions stabilizing or declining, the data backed it up.
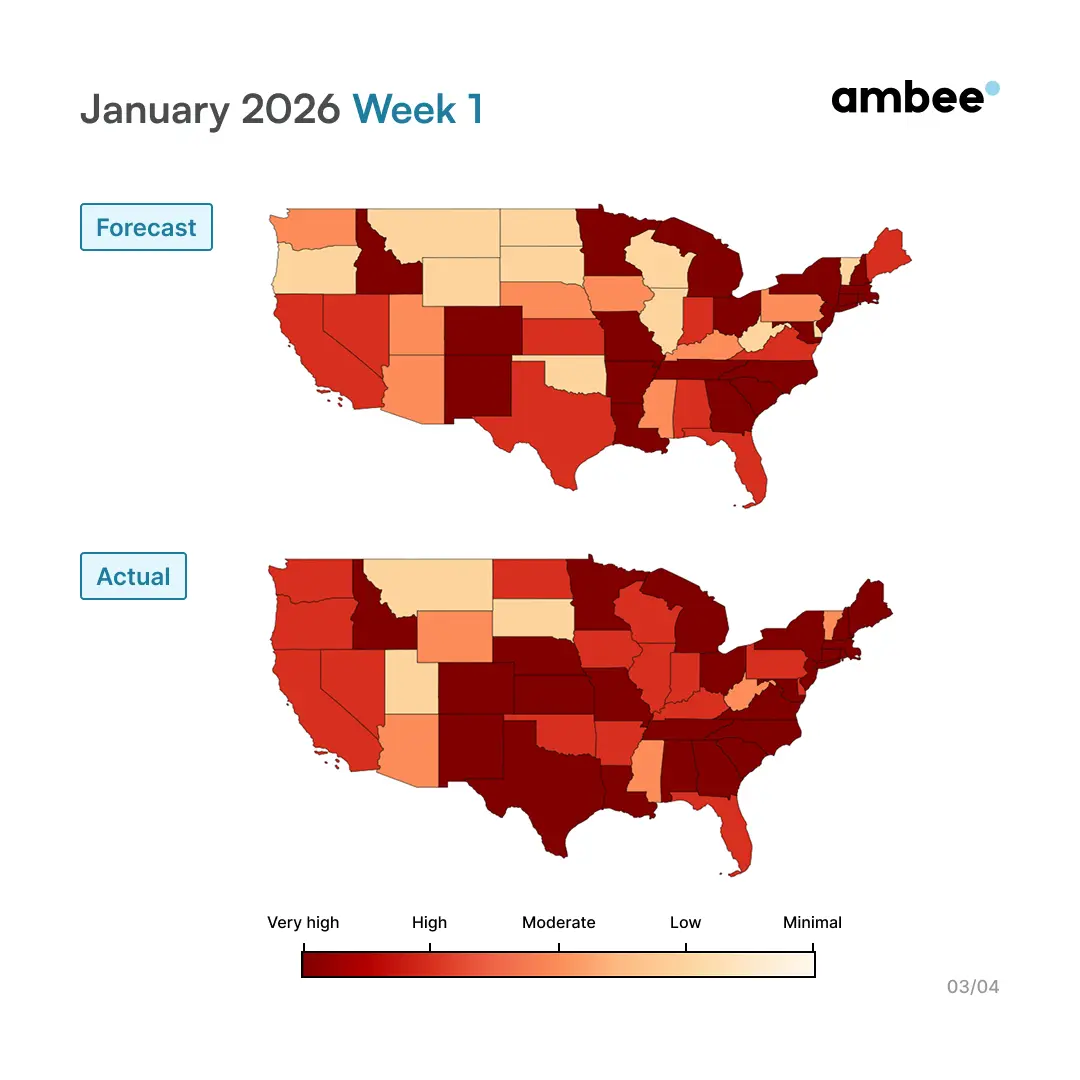
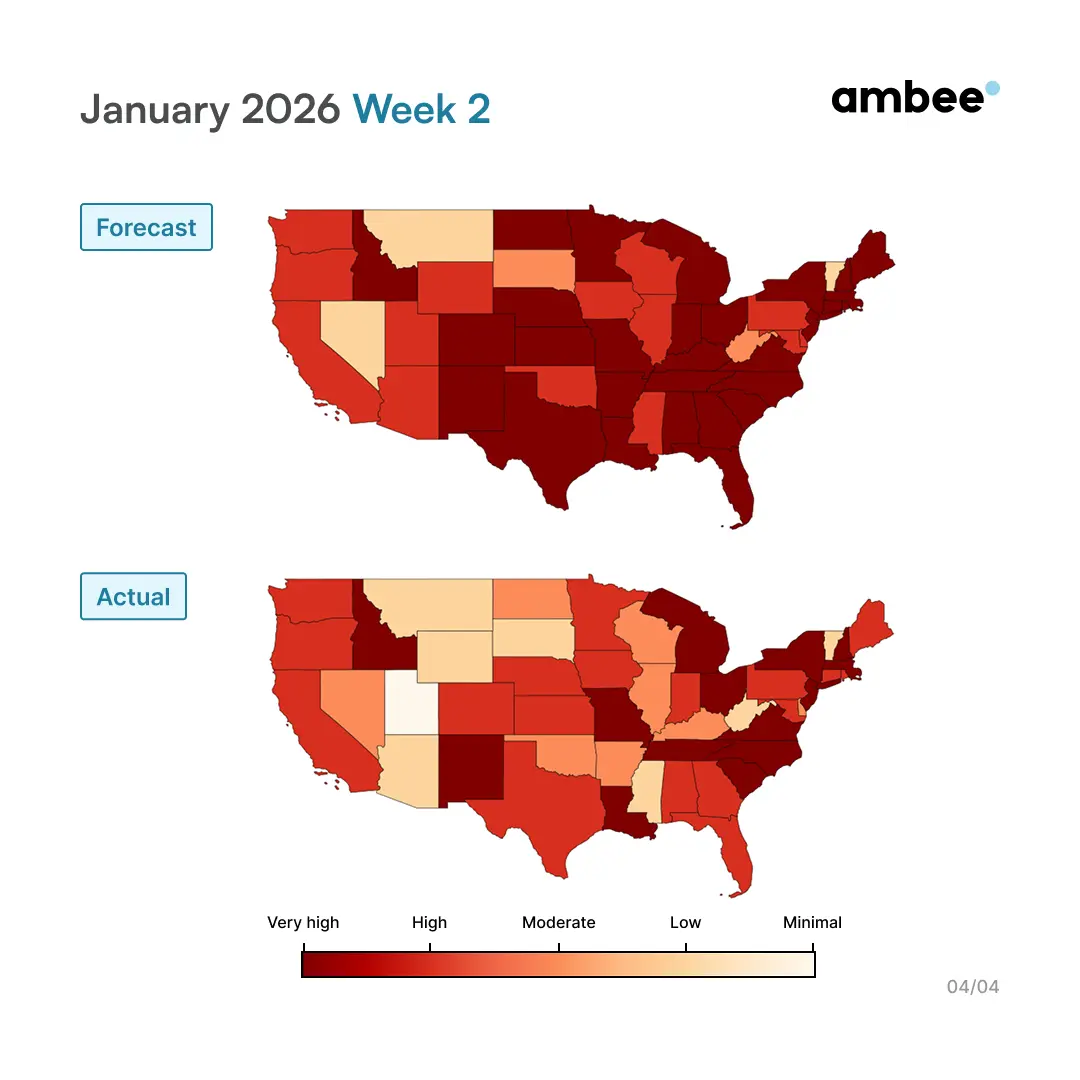
Our forecast showed a very high risk concentrated across the South, Southeast, and parts of the Midwest. The actual data matched almost exactly. The regional patterns, the intensity levels, the pockets of stability in the Northwest all aligned.
The following week, our forecast showed risk intensifying and spreading further across the country. Again, the actual outcomes confirmed it. More states moved into very high-risk territory. The areas we flagged as heating up were the same ones seeing surges in doctor visits and hospitalizations.
This entire exercise is about understanding the value of the lead time.
Ambee’s ILI forecast looks up to four weeks ahead, but the real operational value concentrates in a much narrower window.
The final two to three weeks before a flu surge is when decisions can still be changed.
The model links environmental conditions with health outcomes.
Over several years, we have analyzed how weather patterns, pollen levels, and other environmental signals precede changes in respiratory illness. Across six years of data from Europe and North America, we observed a consistent pattern:
Environmental signals explained 71% of the variation in allergy medication demand, compared to 42% when relying on historical sales alone. That improvement translated into nearly 70% better accuracy.
Pollen levels rise, symptoms follow about two weeks later, and then medication sales spike. The same pattern exists with flu.
So here's what that 28-day window actually enables for the teams managing this crisis.
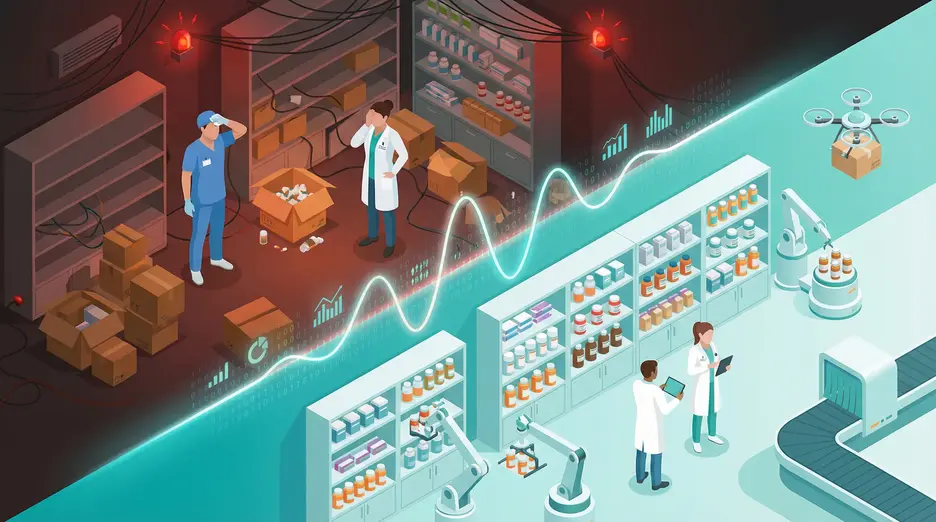
Without lead time:
The pharmaceutical industry has been working to strengthen supply chains after years of disruption, but the challenge remains significant during sudden demand surges. That resilience requires knowing where to position inventory before the crisis hits.
With 2-3 weeks notice:
Without lead time:
This flu season has pushed many hospital systems beyond their normal capacity thresholds. Daniel Park, MD, Medical Director at UNC Children's Hospital, explained the reality on the ground:
"Our children's hospital is bursting at the seams. We're at capacity. We have to get creative in creating space in every crevice of the emergency department."
With 2-3 weeks notice:
Without lead time:
With 2-3 weeks notice:
Without lead time:
The cascade of capacity issues creates downstream problems across the entire healthcare system. Dr. Sean Kumer, Chief Medical Officer at the University of Kansas Health System, described how quickly the situation compounds:
"We have a significant number of folks waiting for beds in the ER. We have a record census so there's no places for people to go... our staff started getting sick."
When hospitals are overwhelmed and staff are falling ill, insurance companies see the financial impact through surging claims. But more importantly, their members are experiencing delayed care, longer wait times, and in many cases, preventable complications.
With 2-3 weeks notice:
We're continuing to track our forecasts against actual outcomes every week through the rest of flu season.
In fact, we have forecast data for the current week as well, which we're sharing below. We'll be back later to match this forecast against the actual outcomes when they're published.
If you work in pharmaceutical distribution, hospital operations, or related sectors, Ambee's ILI risk forecasts are available through our ILI API.
Alternatively, if your team needs specific regional data, custom forecast windows, or support, you can schedule a call with our team to discuss what you're looking for. We're here to help you get ahead of the next surge!