


Air Quality Insights: Ambee’s Approach To Hyper-Local Air Quality Data
April 21, 2024
2 min read


Content Writer

Part 1: How do we measure our Air Quality Data?
99% of us are inhaling polluted air, yet not all of us breathe the same kind of pollutants. The combination of pollutants one is exposed to varies depending on several factors.
This begs the need for hyper-localized air quality data.
At Ambee, we believe that access to clean air is a fundamental human right. So, we developed a cutting-edge AQ technology combining on-ground sensors and satellite data with AI and ML techniques.
Let’s understand how Ambee provides hyper-localized and accurate air quality data to the world. To begin with,
Why do traditional data collection methods fall short?
When it comes to air quality monitoring, we all are aware of conventional approaches that have been in place for years, from low-cost sensors to satellite sources.
However, in today’s data-centric world, these methods have several shortcomings.
1. Official station sources
Typically operated by government agencies or research institutes, they are often limited to highly populated areas. Thus, there is a lack of spatial coverage.
They focus on a single or subset of pollutants, usually PM2.5 and sometimes PM10 and Ozone, creating data gaps. Sensor errors are not checked in real-time, which may lead to inaccurate readings such as negative pollutant values. One such example is Air Now.
2. Low-cost station sources
While they provide valuable data, their focus is to measure only a subset of pollutants, primarily PM (particulate matter). The data is often subjected to sensor errors and does not represent a wide geographical area.
Additionally, traditional monitors are fixed in one location, so they cannot measure localized sources of pollution.
.webp)
In reality, air quality can fluctuate with each passing hour from one street to another.
3. Satellite sources
The satellite data often remain elusive to non-scientific audiences.
Why? Because they provide data in scientific data formats and units that need conversion.
Air quality levels aren’t consistent even within a city, and old methods won’t do the trick if you want personalized, hyper-localized results. The challenges faced by traditional approaches create room for innovation in the realm of air quality monitoring.
How does Ambee ensure accurate AQ monitoring?
We have a comprehensive system designed to provide precise and highly localized air quality data. To achieve this, the data goes through a specific journey.
1. Collection
Our process is meticulous right from the get-go. We factor data from over 60+ sources which include various stations and satellites. To stay up-to-date, our scrapers run for both data sources every hour.
Further, we consolidate data from the same geographic region for maximum accuracy.
2. Processing
Now that we have collected data, the next step is to standardize by converting it into the same formats and units. Then, we keep an eye out for any unexpected values.
An anomaly detection algorithm identifies data like negative pollutants or PM2.5 > PM10, which is scientifically impossible by definition. Ambee’s technology further incorporates sophisticated outlier detection to analyze unusual data points, possibly due to high air pollution events such as wildfires or dust storms.
Next, looking at any data gaps in stations, we employ temporal and spatial methods to fill pollutant values using a mix of historical trends and neighboring stations.
When there are sufficient readings for a pollutant, we step forward to calibrate the satellite data within a 50 km radius of a monitoring station. Additionally, for locations within a 10 km radius of a station, we use an array of geospatial algorithms for precise estimation.
Ultimately, we combine station and satellite sources to provide reliable and accurate global air quality data. Feel free to refer to our air quality technology guide for in-depth understanding.
3. Refinement
At this stage, we filter out bad/unreliable data from sources. Within a 50 km radius of monitoring stations, we calibrate the satellite data with on-ground sensors to improve our prediction accuracy.
As mentioned before, data from satellite and on-ground sensors form a comprehensive view of air quality. It led us to offer actionable insights on 6 key pollutants: PM2.5, PM10, SO2, NO2, CO, and Ozone.
Thanks to the hybrid model, our reach is global.
4. Delivery
Welcome to the most crucial step in our data pipeline. Here, we have various options to ensure our air quality data reaches you in the most seamless way.
You can tap into our air quality API for real-time information. Our data is available across cities, latitudes, and longitudes in Asia, Europe, NA, and ANZ. The spatial resolution is 5 sq km with the capability to go down further, and the temporal resolution is hourly and daily.
Need a bit of air quality history? No problem.
Ambee’s API can instantly provide data for the past 48 hours. You can download bulk historical air quality data for over 30 years. Additionally, enjoy on-demand access to 10-day forecast data.
Our API has predictable resource-oriented URLs, accepts form-encoded request bodies, and returns JSON-encoded responses.
Here are a couple of samples of what it looks like–
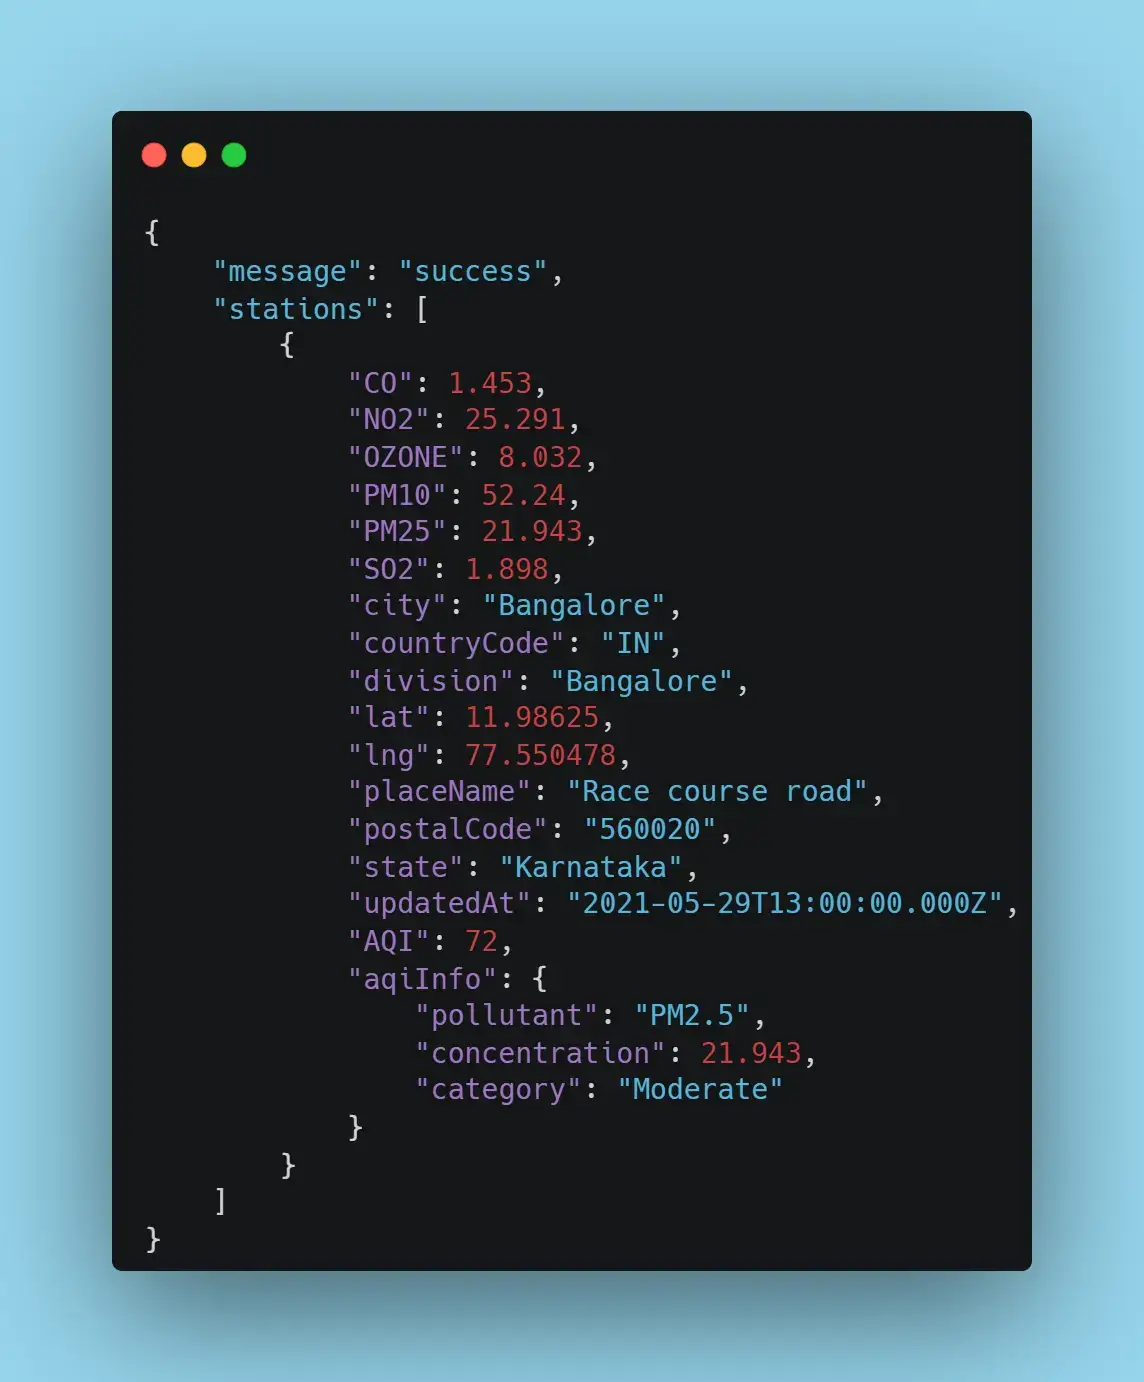
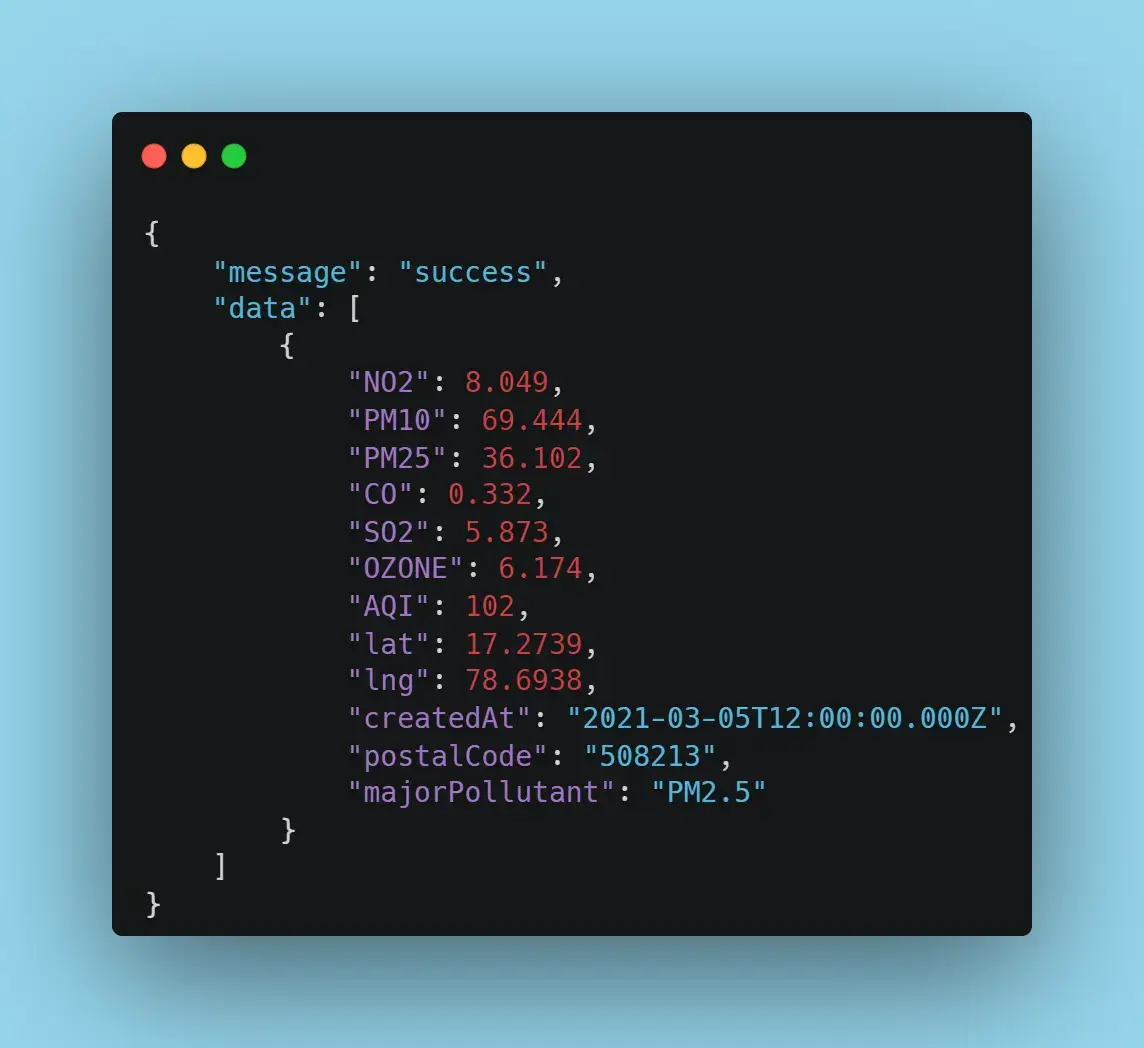
Wait, there’s more! We offer custom data delivery with S3 buckets and custom APIs too.
We are fluent in multiple languages as well as AQI standards. But by default, we roll with US EPA AQI standards. Have a look at our air quality documentation for a complete picture.
Why wait? The solution is right here at your fingertips.
Sign up for free to access 100 API records/day for 15 days.
Ambee's air quality technology is built with innovative solutions. Our strength lies in adding more features to our product to provide a seamless experience to users. Webhooks, our latest weapon, can deliver you real-time alerts for changes in air quality and more.
We understand that receiving different air quality updates for a location might be confusing. It happens when you’re looking at different sources. To know more, stay tuned to our next blog.
Have questions?
Get in touch!
Get in touch!
Request submitted.
Our team will get in touch with you shortly!
Our team will get in touch with you shortly!
Oops! Something went wrong while submitting the form.


